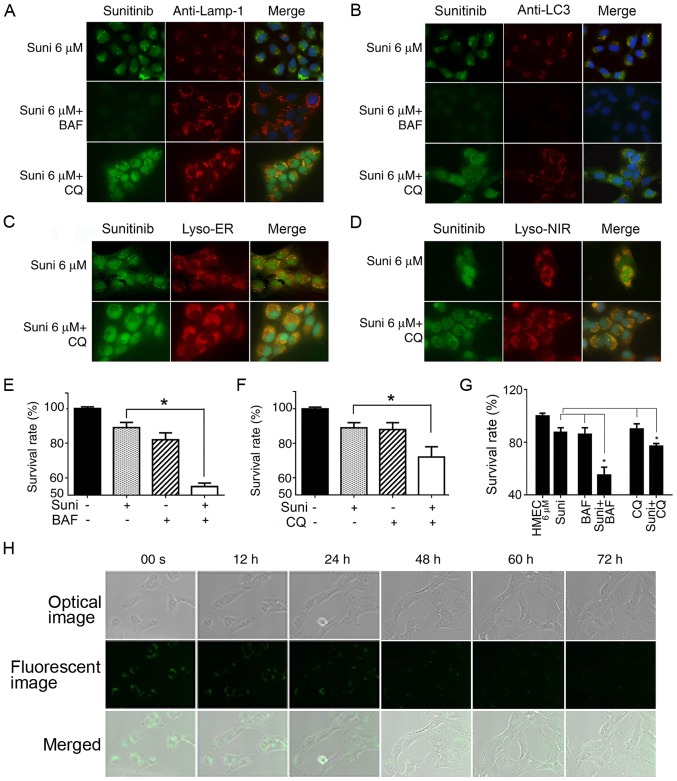
Figure 4.
Reversal of resistance to sunitinib in HMEC-1 cells by autophagy inhibitors. (A-D) HMEC-1 cells were treated with 6 µM sunitinib for 24 h, either alone or in the presence of 10 nM BAF or 20 µM CQ for 4 h. DAPI was added to stain the nuclei. (A) Cells were then stained with anti-LAMP and observed under fluorescence microscopy. (B) Treated and non-treated HMEC-1 cells underwent anti-LC3 staining and were observed under fluorescence microscopy. (C) Treated or non-treated HMEC-1 cells underwent Lyso-ER staining for 30 min and were observed under fluorescence microscopy. (D) Treated or non-treated HMEC-1 cells underwent Lyso-NIR staining for 30 min and were (A-D) Magnification, ×63. (E) Survival rates of HMEC-1 cells following treatment with sunitinib with or without BAF. HMEC-1 cells were incubated with or without 6 µM sunitinib or 10 nM BAF for 48 h. Cells were trypsinized and counted. *P<0.05. (F) Survival rates for HMEC-1 cells following treatment with sunitinib with or without CQ. HMEC-1 cells were incubated with or without 6 µM sunitinib or 20 µM CQ for 48 h. Cells were trypsinized and counted. *P<0.05. (G) Survival rates for HMEC6 µM cells following treatment with sunitinib with or without BAF or CQ. HMEC6 µM cells were incubated with or without 6 µM sunitinib, 10 nM BAF or 20 µM CQ for 48 h. Cells were trypsinized and counted. *P<0.05. The results in e, f and g are presented as the mean ± SEM. (H) Steady decrease in sunitinib fluorescent density in cell vesicles following the withdrawal of sunitinib from culture media. HMEC6 µM cells were washed and cultured in normal culture medium. The cells were immediately placed into the culture chamber of a time-lapse imaging system. After image zone selection, image recording usually began after 15 min. The images were taken every 12 min and the images at indicated time points are shown. The upper row shows optic microscope images, the middle row shows green fluorescent microscope images and the lower row shows merged photos (magnification, ×40). BAF, bafilomycin A1; CQ, chloroquine; LAMP-1, lysosomal-associated membrane protein 1; LC3, microtubule-associated protein 1A/1B-light chain 3; Suni, sunitinib.

