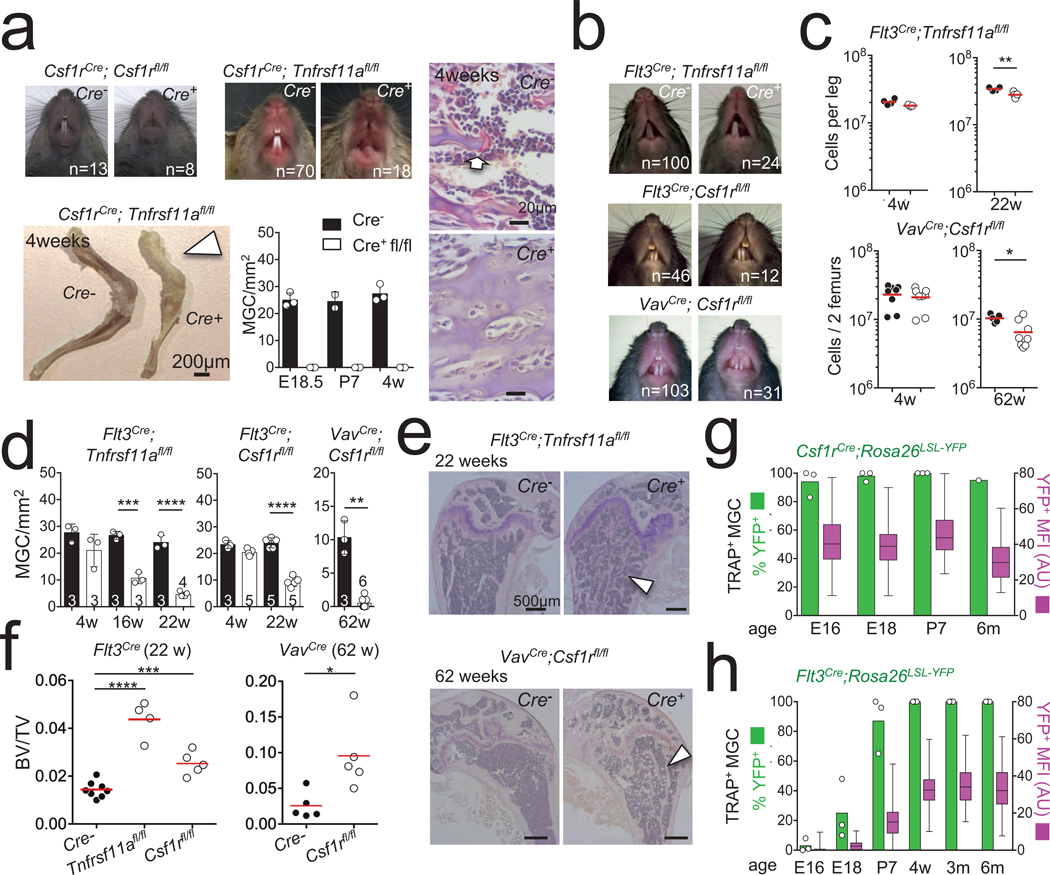
Fig. 1 |. HSC-derived precursors are dispensable for osteoclasts and bone development.
a, Representative photographs of teeth of three-to-four-week-old Csf1rCre;Csf1rfl/fl mice (top left), Csf1rCre;Tnfrsf11afl/fl mice (top middle) and control littermates. Bottom left, representative photographs of leg bones from controls and Csf1rCre;Tnfrsf11afl/fl mice; white arrowhead highlights the lack of blood cells. Bottom middle, osteoclast numbers in E18.5, P7, and four-week-old Csf1rCre;Tnfrsf11afl/fl mice (n = 3) and control littermates (n = 3), and representative haematoxylin and TRAP staining of femur sections; the arrow indicates an osteoclast. b, Representative photographs of teeth of three-to-four-week-old Flt3Cre;Tnfrsf11afl/fl, Flt3Cre;Csf1rfl/fl, VavCre;Csf1rfl/fl mice and littermates. c, Bone marrow CD45+ cell numbers in Flt3Cre;Tnfrsf11afl/fl and control littermates at 4 (top left, n = 4 Flt3Cre;Tnfrsf11afl/fl, n = 3 control) and 22 weeks of age (top right; n = 4 Flt3Cre;Tnfrsf11afl/fl, n = 5 control) and VavCre;Csf1rfl/fl and control littermates at 4 (bottom left; n = 8 VavCre;Csf1rfl/fl, n = 8 control) and 62 weeks of age (bottom right; n = 5 VavCre;Csf1rfl/fl, n = 8 control), Cre- black Cre+ white. d, Osteoclast counts in femurs from Flt3Cre;Tnfrsf11afl/fl (left), Flt3Cre;Csf1rfl/fl (middle) and VavCre;Csf1rfl/fl (right) mice and control littermates of the indicated ages, n numbers indicated on individual bars. e, Representative haematoxylin and TRAP staining of femur sections from 22-week-old Flt3Cre;Tnfrsf11afl/fl mice (top), 62-week-old VavDD/Cre;Csf1rfl/fl mice (bottom) and control littermates. The white arrowhead points to trabecular bone. f, Quantitative analysis of bone volume/total volume of humerus or femurs from Flt3Cre;Tnfrsf11afl/fl (n = 4), Flt3Cre;Csf1rfl/fl (n = 5) and control littermates (n = 8), and VavCre;Csf1rfl/fl (n = 5) mice and control littermates (n = 5) as determined by micro-CT. P values were determined by ANOVA. g, Expression and mean fluorescence intensity (MFI) of YFP in TRAP+ multinucleated cells from Csf1rCre;Rosa26LSL-YFP mice at E16.5, E18.5, P7 and six months (n = 3 per time point). For MFI and percentages, at least 100 osteoclasts were quantified per time point and genotype. Box plots show the median, box edges show the first and third quartiles and whiskers show the minimum and maximum. h, Similar analysis as in g, for Flt3Cre;Rosa26LSL-YFP mice at E16.5, E18.5, P7, 4 weeks (4 wk), 3 months (3 m) and 6 months (6 m). Data are mean ± s.d.; dots in graphs represent individual independent biological replicates; n indicates the number of mice per group. Statistical significance was analysed with GraphPad Prism using unpaired two-tailed t-tests unless otherwise indicated. *P < 0.05, **P < 0.01, ***P < 0.001 and ****P < 0.0001.

