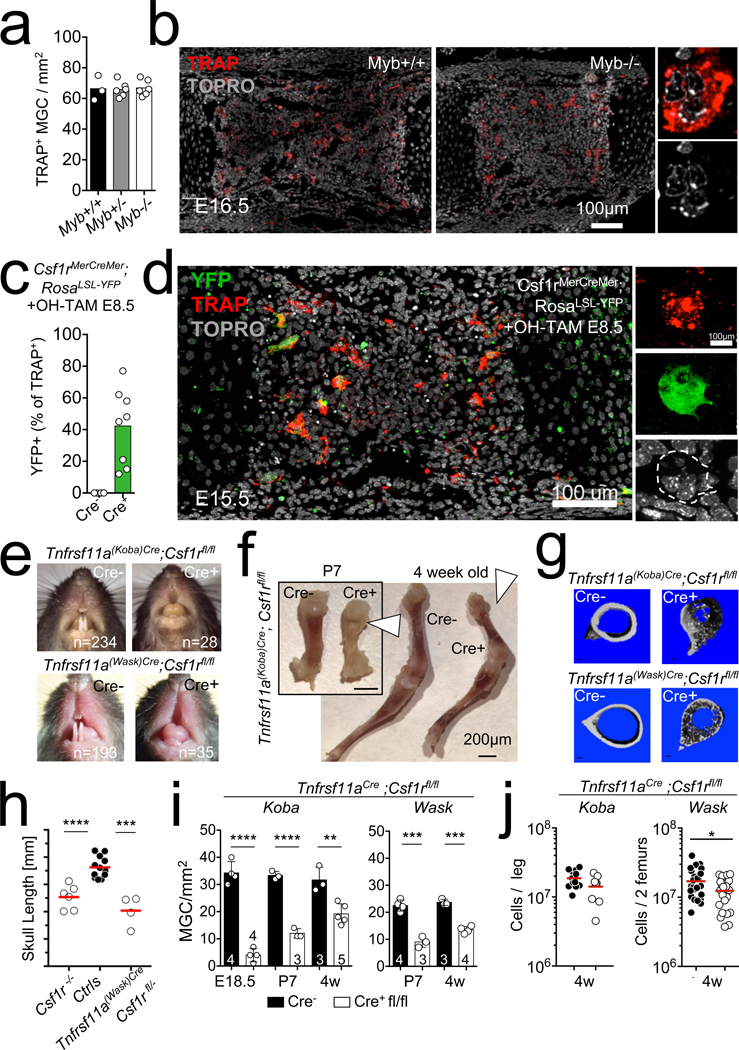
Fig. 2 |. EMP-derived osteoclasts are required for bone development.
a, MGC number in femur anlage ossification centres from E15.5–16.5 Myb−/− (n = 6) and littermate controls (n = 3). b, Representative confocal microscopy of frozen sections from the ossification centres in a, stained for TRAP and with TO-PRO-3 nuclear stain. c, Percentage of TRAP+ cells expressing YFP in femur anlage from E15.5 Csf1rMer-iCre-Mer;Rosa26LSL-YFP mice (n = 8) and Cre-negative controls (n = 5), pulsed at E8.5 with 4-OHT. d, Representative confocal microscopy of a sample from c. e, Representative teeth of cre+ Tnfrsf11aKoba-Cre;Csf1rfl/fl (top) and Tnfrsf11aWask-Cre;Csf1rfl/fl mice (bottom) and cre− control littermates. f, Leg bones from Tnfrsf11aCre;Csf1rfl/fl mice (cre+, n = 6) and control littermates (cre−, n = 6) at P7 and 4 weeks of age. Arrowhead highlights the colour of an area of bone. g, Representative micro-CT scans of long bones from mice in e (n = 6 per genotype). h, Skull length from three-week-old Csf1r−/− (n = 6) control littermates (n = 12) and Tnfrsf11aWask-Cre;Csf1rfl/fl mice (n = 4), as determined by micro-CT. i, Osteoclast counts in bone sections from E18.5, P7 and three-to-four-week old Tnfrsf11aCre;Csf1rfl/fl mice and littermate controls. j, Number of bone marrow CD45+ cells determined by flow cytometry of cells from four-week-old control (cre−) littermates, Tnfrsf11aKoba-Cre;Csf1rfl/fl (n = 9; n = 13 control) and Tnfrsf11aWask-Cre;Csf1rfl/fl (n = 23, n = 27 control) mice (cre+). Data are mean ± s.d.; dots in graphs represent individual mice; n indicates the number of mice per group; unpaired two-tailed t-tests. *P < 0.05, **P < 0.01, ***P < 0.001 and ****P < 0.0001.

