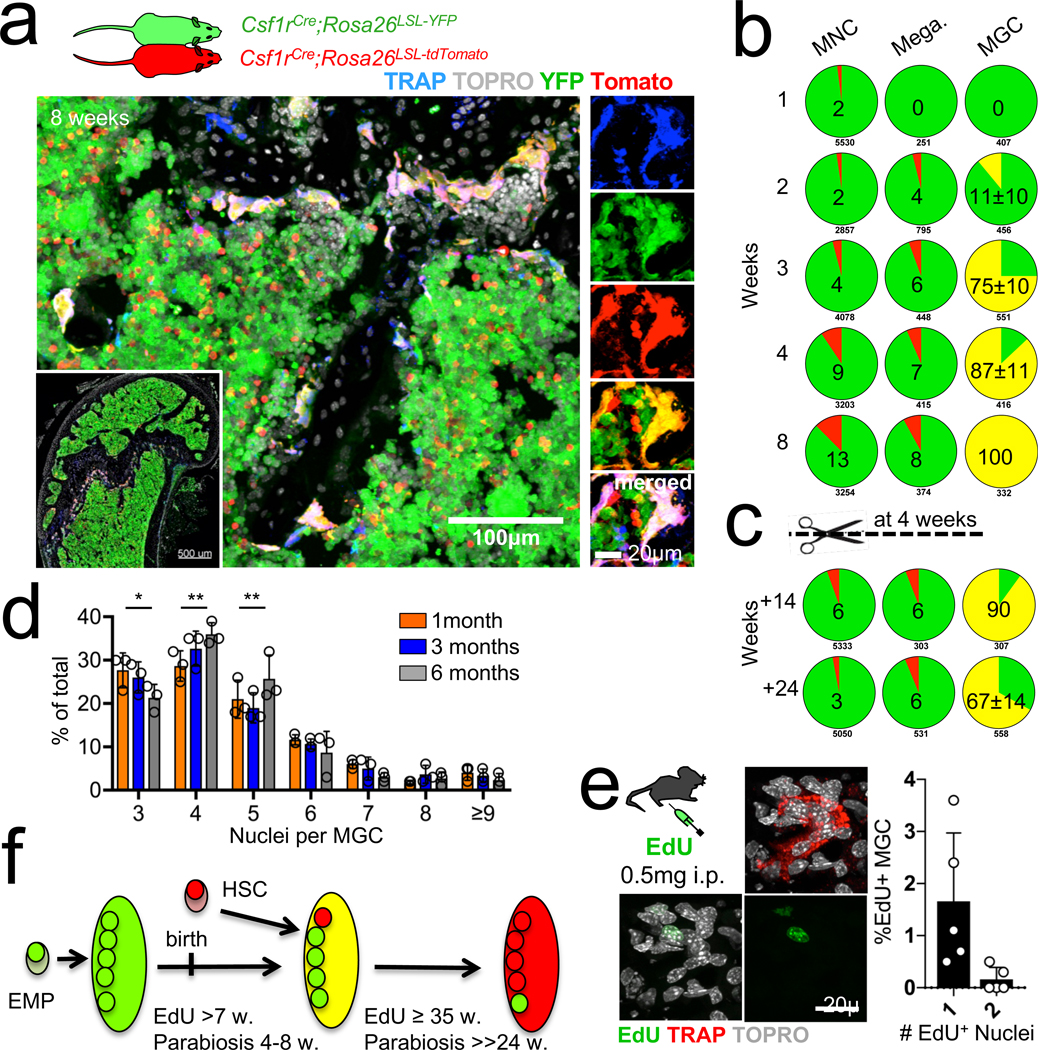
Fig. 3 |. In vivo dynamics of osteoclasts.
a, Parabiosis of Csf1rCre;Rosa26LSL-YFP mouse surgically paired with a Csf1rCre;Rosa26LSL-tdTomato partner for four-to-eight weeks. Representative confocal microscopy of frozen sections from the femur of a Csf1rCre;Rosa26LSL-YFP partner stained with antibodies for tdTomato (red) and YFP (green), ELF 97 (blue) and TOPRO-3 (grey). n = 3. b, Pie graphs showing the percentage of tdTomato+ (red), YFP+ (green) and tdTomato+YFP+ cells (yellow) among bone marrow mononuclear cells (MNC), megakaryocytes and multinuclear giant cells (MGC) from parabionts paired for the indicated time (n = 8). c, Similar analysis as in b for parabionts separated after four weeks and analysed 14 and 24 weeks after separation (n = 3). d, Bar graph showing number of nuclei per TRAP+ MGC in femurs from wild-type mice at one, three and six months of age (n = 3 mice per time point). e, Representative confocal microscopy of an EdU-labelled nucleus in a TRAP+ osteoclast (left) and histogram showing the percentage of TRAP+ osteoclasts with EdU-labelled nuclei and the number of labelled nuclei per cell 72 h after intravenous pulse-labelling with EdU (n = 5 mice). f, A model for development and maintenance of osteoclast syncytia. Data are mean ± s.d.; dots in graphs represent individual mice; n indicates the number of mice per group; two-way ANOVA with Tukey’s multiple comparisons test *P ≤ 0.05 and **P ≤ 0.005.

