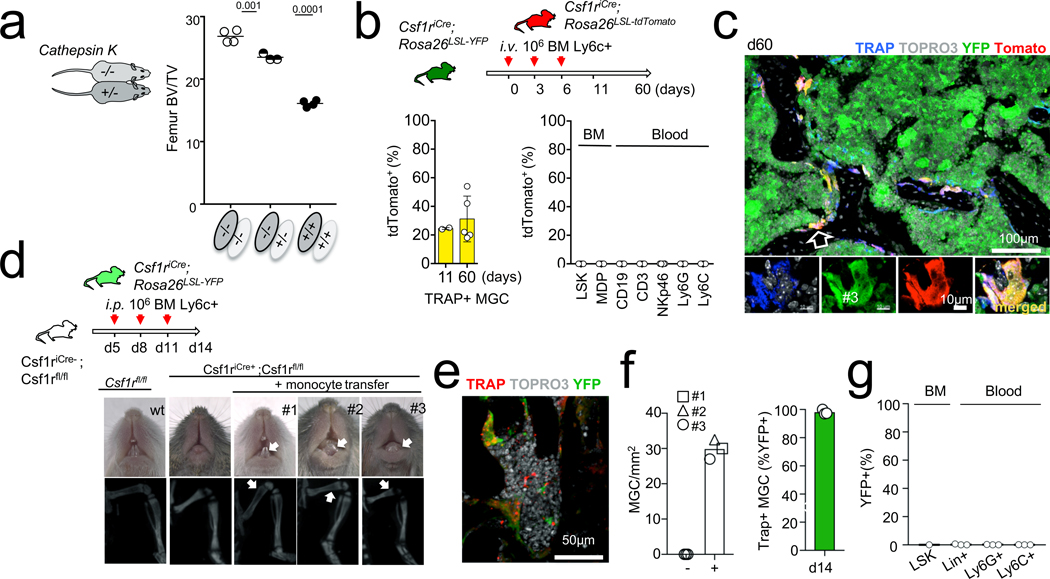
Fig. 4 |. Rescue of osteopetrosis.
a, Bone volume/total volume for femurs from 10-week-old cathepsin K−/− mice (n = 3) after six weeks parabiosis with cathepsin K+/− mice and from positive (n = 4) and negative (n = 4) control parabionts, analysed by von Kossa staining. b, Monocyte transfer. Histograms represent percentage of tdTomato+ cells among bone TRAP+ MGCs from Csf1rCre;Rosa26LSL-YFP recipients analysed by confocal microscopy (left) 11 days (n = 2) and 60 days (n = 5) after intravenous transfer at six weeks of age of 3 × 10⁶ Ly6C+ bone marrow cells from Csf1rCre;Rosa26LSL-tdTomato donors, and percentages of tdTomato+ cells among bone marrow precursors and blood leukocytes, analysed by flow cytometry after 60 days (n = 5, right). c, Representative high-power confocal microscopy of the femur of a recipient mouse 60 days after intravenous transfer (from b), stained with antibodies for tdTomato and YFP, ELF97 phosphatase substrate and TOPRO-3. d, Representative photographs of teeth (top) and CT scan of leg bones from Csf1rcre;Csf1rfl/fl mice (n = 3) transferred with monocytic cells from Csf1rCre;Rosa26LSL-YFP donors at P5, P8 and P11, and from wild-type and non-transferred Csf1rcre;Csf1rfl/fl controls. Arrows indicate the presence of teeth eruption (top panels) and bone marrow cavity (bottom panels). e, Representative confocal microscopy of a femur from mouse no. 3 in d, stained with YFP antibody and with ELF97 and TOPRO-3. f, Number of TRAP+ osteoclasts in bone sections from mice in d and non-transferred controls (left), and percentage of YFP+ TRAP+ cells in transferred mice. The different symbols represent individual mice. Mean values for three sections per mouse. At least 100 osteoclasts were quantified per mouse. g, Percentages of YFP+ cells among bone marrow precursors and blood leukocytes in the recipient mice (from d) at the time of analysis. Data are mean ± s.d.; dots in graphs represent individual mice; n indicates the number of mice per group; ANOVA with Tukey’s multiple comparisons test. ***P < 0.001 and ****P < 0.0001.

