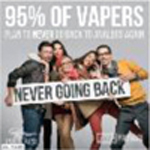
Table 1.
Adolescents’ and Young Adults’ Perception of Claims for Each Advertisement; All Participants (N = 245) and by Tobacco Use Experience (Never-User: N = 173, Ever-User: N = 72)
 Explicit 1: Veppo Explicit 1: Veppo |
 Explicit 2: ProVape Explicit 2: ProVape |
 Implicit 1: Blu Implicit 1: Blu |
 Implicit 2: NJOY Implicit 2: NJOY |
|||||||||
|---|---|---|---|---|---|---|---|---|---|---|---|---|
| “The product…” | All | Ever-user | Never-user | All | Ever-user | Never-user | All | Ever-user | Never-user | All | Ever-user | Never-user |
| “Helps me quit smoking regular cigarettes” |
178 (72.7%) |
52 (72.2%) |
126 (72.8%) |
134 (54.7%) |
39 (54.2%) |
95 (54.9%) |
84 (34.3%) |
29 (40.3%) |
55 (31.8%) |
56 (22.9%) |
19 (26.4%) |
37 (21.4%) |
| “Is healthier than regular cigarettes” | 89 (36.3%) |
30 (41.7%) |
59 (34.1%) |
124 (50.6%) |
33 (45.8%) |
91 (52.6%) |
116 (47.3%) |
37 (51.4%) |
79 (45.7%) |
75 (30.6%) |
27 (37.5%) |
48 (27.8%) |
| “Is less harmful to my health” | 109 (44.5%) |
34 (47.2%) |
75 (43.4%) |
111 (45.3%) |
35 (48.6%) |
76 (43.9%) |
108 (44.1%) |
37 (51.4%) |
71 (41.0%) |
72 (29.4%) |
27 (37.5%) |
45 (26.0%) |
| “Is okay to smoke anywhere” | 18 (7.3%) |
8 (11.1%) |
10 (5.8%) |
48 (19.6%) |
15 (20.8%) |
33 (19.1%) |
108 (44.1%) |
39 (54.2%) |
69 (39.9%) |
39 (15.9%) |
13 (18.1%) |
26 (15.0%) |
|
“Makes me
look cool” |
44 (18.0%) |
13 (18.1%) |
31 (17.9%) |
80 (32.7%) |
23 (31.9%) |
57 (33.0%) |
129 (52.7%) |
41 (56.9%) |
88 (50.9%) |
48 (19.6%) |
13 (18.1%) |
35 (20.2%) |
| “Tastes good” | 18 (7.3%) |
8 (11.1%) |
10 (5.8%) |
36 (14.7%) |
8 (11.1%) |
28 (16.2%) |
77 (31.4%) |
26 (36.1%) |
51 (29.5%) |
26 (10.6%) |
10 (13.9%) |
16 (9.3%) |
| “Helps me socialize more” | 26 (10.6%) |
10 (13.9%) |
16 (9.3%) |
106 (43.3%) |
32 (44.4%) |
74 (42.8%) |
61 (24.9%) |
22 (30.6%) |
39 (22.5%) |
14 (5.7%) |
3 (4.2%) |
11 (6.4%) |
| “None of the above” | 49 (20.0%) |
14 (19.4%) |
35 (20.2%) |
47 (19.2%) |
15 (20.8%) |
32 (18.5%) |
48 (19.6%) |
11 (15.3%) |
37 (21.4%) |
106 (43.3%) |
26 (36.1%) |
80 (46.2%) |
Note. Out of the 248 participants, 3 did not respond to the tobacco use experience question, hence removed from the table. The % in parentheses is the proportion of participants who selected the claim. The sum exceeds 100% since a participant could select multiple claims as applicable. Highlighted cells indicate the most frequently selected claim for the given advertisement within each group.
