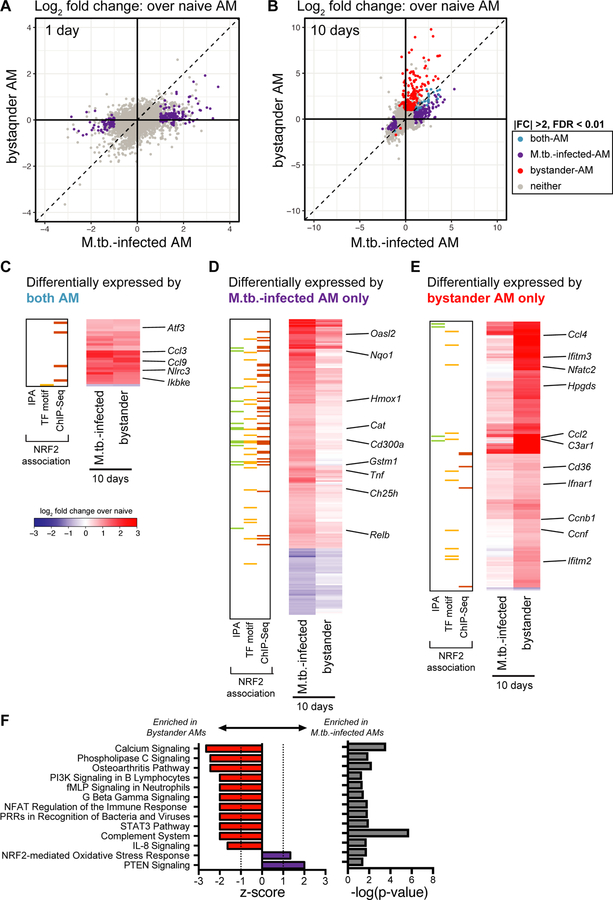
Figure 5: Bystander AMs express a unique transcriptional signature 10 days after infection.
(A, B) Scatterplots comparing gene expression values (log2 fold change over average of naïve AMs) for H37Rv-infected versus bystander AMs at 1 day (A) and 10 days (B) post-infection with significant differentially expressed genes highlighted (|fold change| > 2 and FDR < 0.01, Benjamini-Hochberg calculated). Data is presented from 3 independent experiments. (C, D, E) Heatmaps of log2 fold change gene expression at 10 days over average of naïve AMs. Colored bars indicate NRF2 association as described in Figure 2. (C) 28 genes differentially expressed by both bystander and M.tb.-infected AMs. (D) 200 genes differentially expressed only by M.tb.-infected AMs. (E) 177 genes differentially expressed only by bystander AMs. Columns represent the average of three independent experiments. Genes of interest noted to the right. (F) Ingenuity Pathway Analysis comparing gene expression from bystander AMs and M.tb.-infected AMs. Canonical pathways with |z-scores| >1 and p-values < 0.05 were reported.

