FIG. 1.
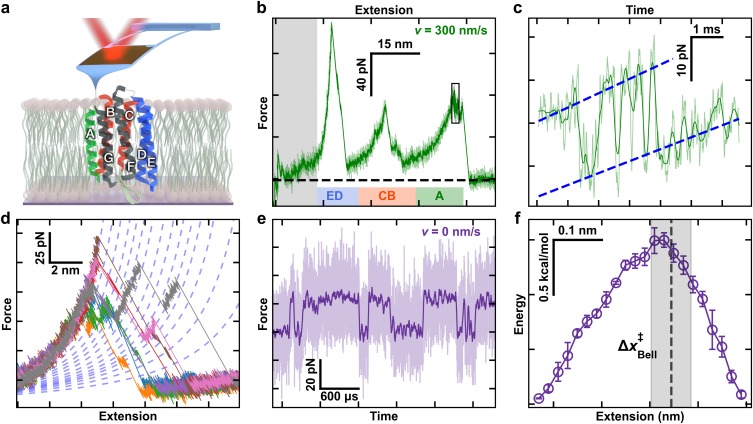
High-resolution studies of bacteriorhodopsin (BR). (a) A cartoon illustrating BR being unfolded from its C-terminal end using a modified, ultrashort cantilever. Each helix is denoted by a letter. Color coding highlights the unfolding topology as helix pairs or the terminal A helix is extracted. (b) A canonical force-extension curve while stretching at v = 300 nm/s shows the major intermediates corresponding to pulling on the top of the E, C, and A helices. The initial portion of the force-extension curves was not analyzed due to the confounding effects of non-specific surface adhesion (grey box). The colored bars correspond to the colored helical regions from panel (a). (c) Force-vs-time record of the highlighted black box in panel (b) shows near-equilibrium unfolding and refolding at the top of helix A over a 13-amino-acid (aa) segment. (d) Multiple force-extension curves of BR show numerous detected unfolding intermediates. Curves were well modeled by a worm-like chain model within a particular state (dashed lines). (e) Force-vs-time record shows repeated unfolding and refolding of a 3-aa segment during an equilibrium assay (v = 0 nm/s) near the top of helix E. For clarity, 5-MHz data (light purple) were smoothed to 25 kHz (dark purple). (f) A reconstructed 1D free-energy landscape based on ∼100-ms records of equilibrium data with 1-μs resolution tilted to F1/2, the force at which the two states are equally likely to be occupied. Reconstruction was based on pfold.40 Error bars represent the standard error of the mean. Dashed line represents the location of transition state determined from a Bell analysis of state lifetime, with the grey box denoting the standard deviation in that localization. The data for Figs. 1(b)–1(f) are from Ref. 18.

