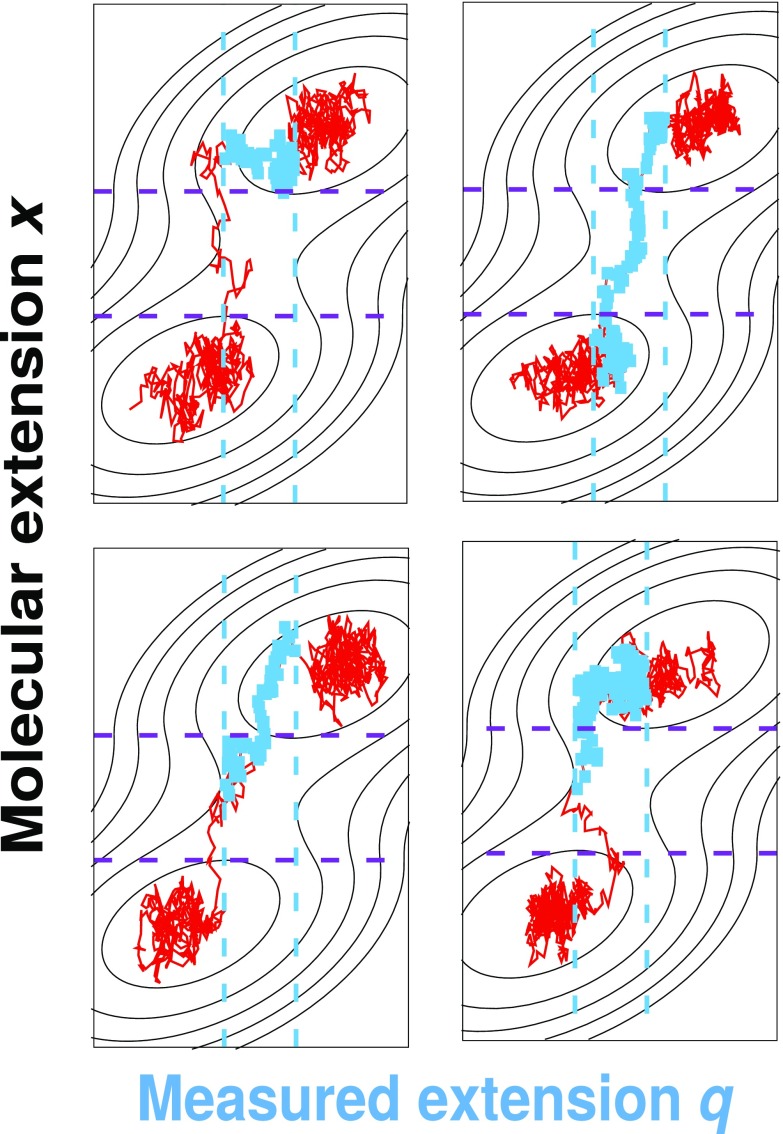
FIG. 8.
Examples of 2D transition paths (solid red lines) from the 2D Brownian dynamics simulations with Dx/Dq = 1 as a function of the total measured extension q and the molecular extension x. The blue squares indicate the transition paths selected by analyzing the dynamics only along the measured extension q. Blue and purple dashed lines indicate the transition path limits along q and x, respectively. Note that in the top left panel, the q transition path (blue) has little to do with crossing the saddle but reflects the relaxation of the total extension after a molecular transition has taken place.

