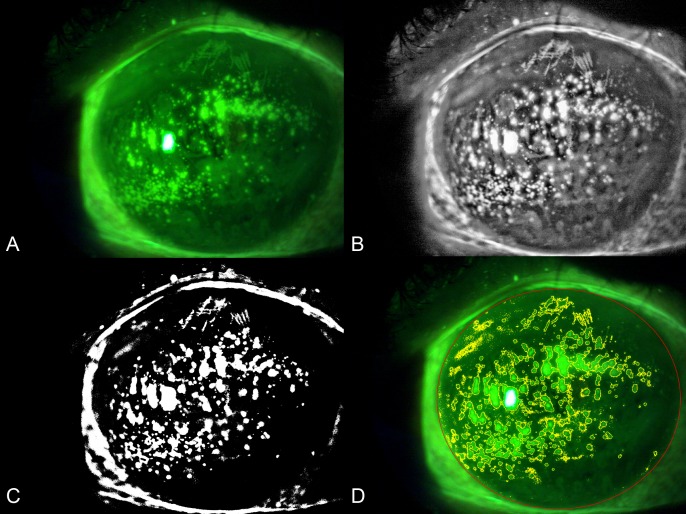
Figure 1.
Representative result of the evaluation of CFS with digital image analysis. (A) Original image. (B) Contrast-limited adaptive histogram equalization and median filter were applied, and the green channel was split from the image. (C) The MaxEntropy auto threshold function was applied to binarize the image. (D) The color threshold tool was used to select the white pixels; the CSI was computed dividing the staining area (yellow lines) by the total corneal area (red line).

