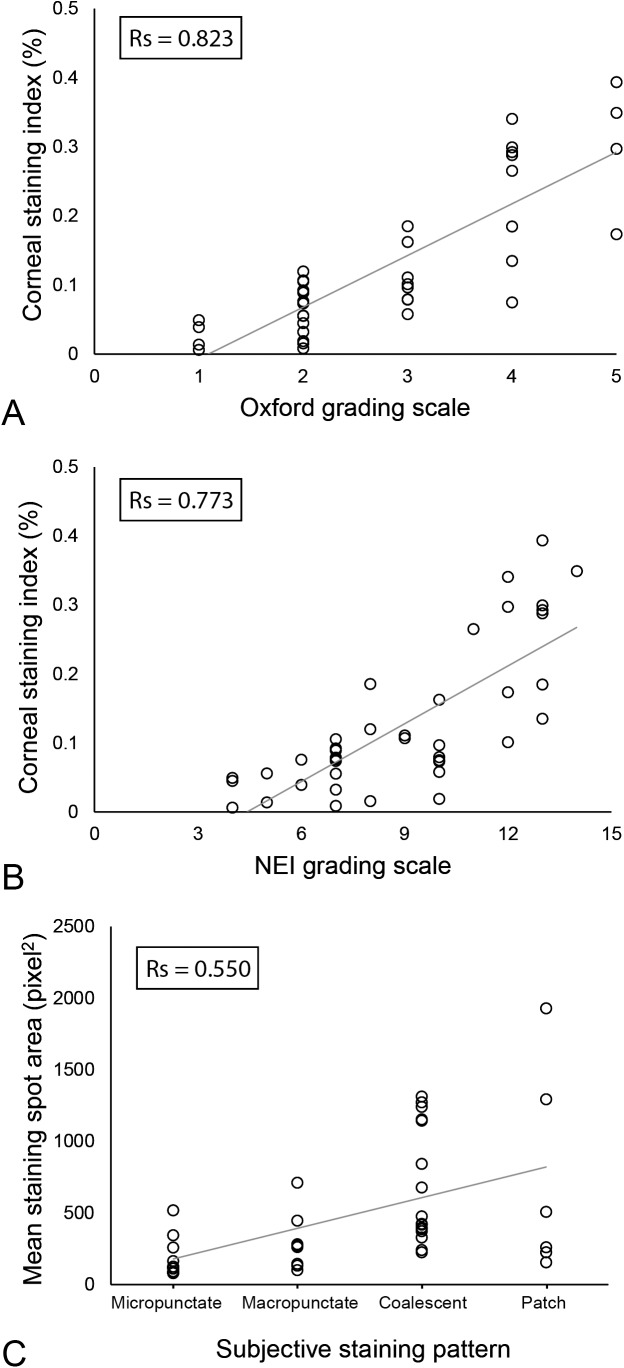
Figure 2.
Scatterplots showing the relationship between the subjective grading of CFS and the results of the technique based on digital image analysis. (A) Oxford grading scale versus CSI calculated with digital image analysis (Rs = 0.823, P < 0.001). (B) NEI grading scale versus CSI calculated with digital image analysis (Rs = 0.773, P < 0.001). (C) Subjective classification of the pattern of staining versus mean area of staining spots calculated with particles analysis (Rs = 0.550, P < 0.001).

