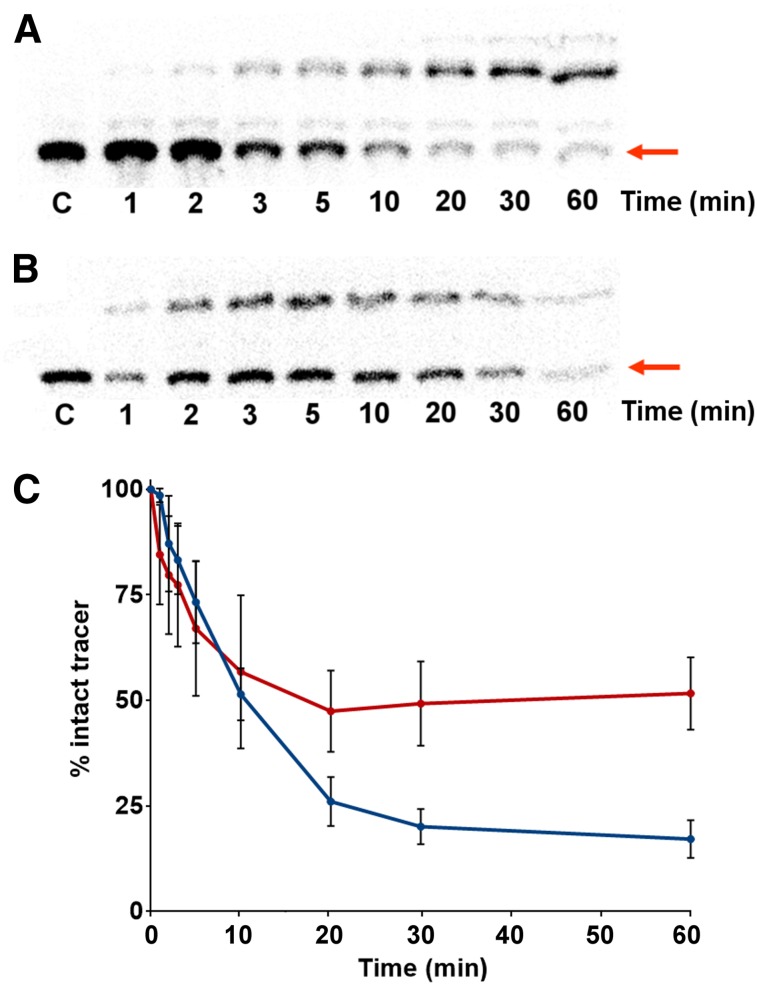
FIGURE 1.
Relative metabolite quantification in plasma after injection of either 18F-FES or 18F-4FMFES. (A and B) Representative autoradiography of reverse-phase TLC of multiple blood samplings through time after injection of either 18F-FES (A) or 18F-4FMFES (B). Band corresponding to intact tracer (red arrow) is compared with total radioactivity for each lane. (C) Tracer–to–total radioactivity ratio is expressed as percentage intact tracer. 18F-4FMFES (red curve) has significantly higher percentage intact tracer than 18F-FES (blue curve) at 20 min and afterward (n = 10; P < 0.001).

