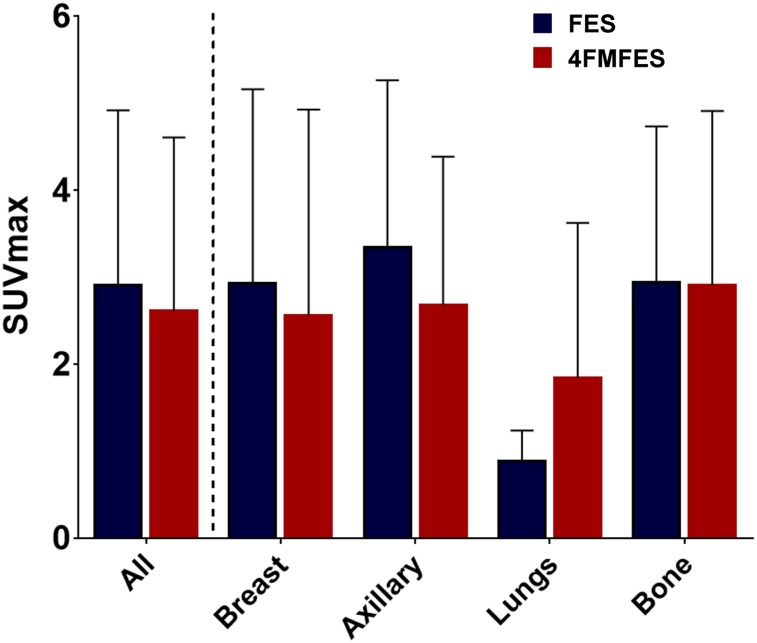
FIGURE 4.
18F-FES and 18F-4FMFES uptake of assessed tumors, expressed as SUVmax of representative ROIs. More tumors were identified using 18F-4FMFES PET (n = 105) than 18F-FES PET (n = 96). Although small trend toward lower uptake with 18F-4FMFES PET was observed, difference was not significant, nor did segmentation of tumor pool according to site of presentation show significantly different uptake.

