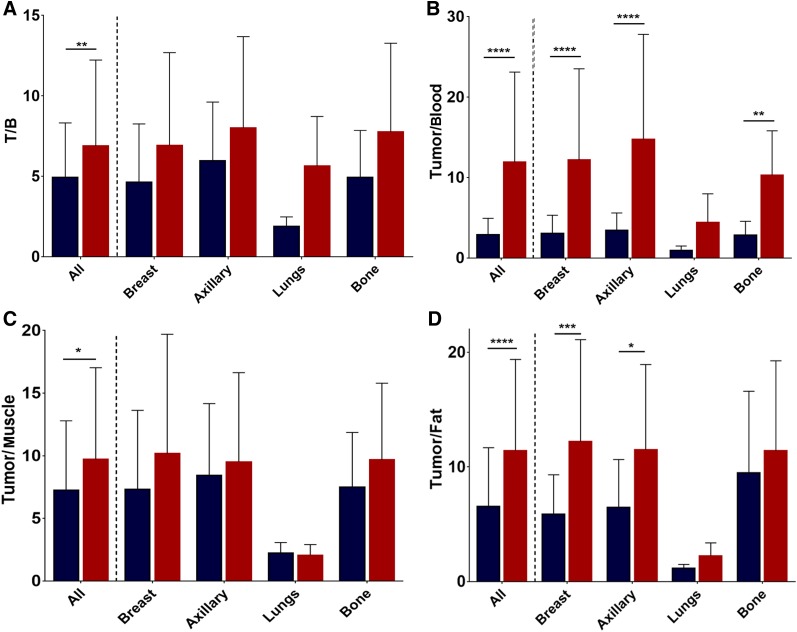
FIGURE 6.
18F-FES (blue) and 18F-4FMFES (red) tumor-to-background (T/B) (A), tumor-to-blood (B), tumor-to-muscle (C), and tumor-to-fat (D) ratios. 18F-4FMFES achieved significantly better tumor contrast than 18F-FES regardless of nonspecific tissue of reference. Significantly higher tumor-to-blood and tumor-to-fat ratios were also observed for 18F-4FMFES when subcategorizing tumor pool according to tumor site. *P < 0.05. **P < 0.01. ***P < 0.005. ****P < 0.001.

