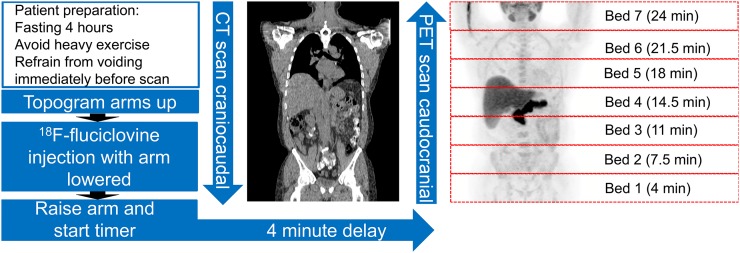
FIGURE 4.
Schema of 18F-fluciclovine PET/CT acquisition adapted from Emory clinical protocol. Maximum-intensity-projection 18F-fluciclovine images show normal biodistribution. Pancreas uptake is relatively higher than liver uptake, consistent with ideal time of image acquisition after injection. PET bed-position times are after injection (p.i.).

