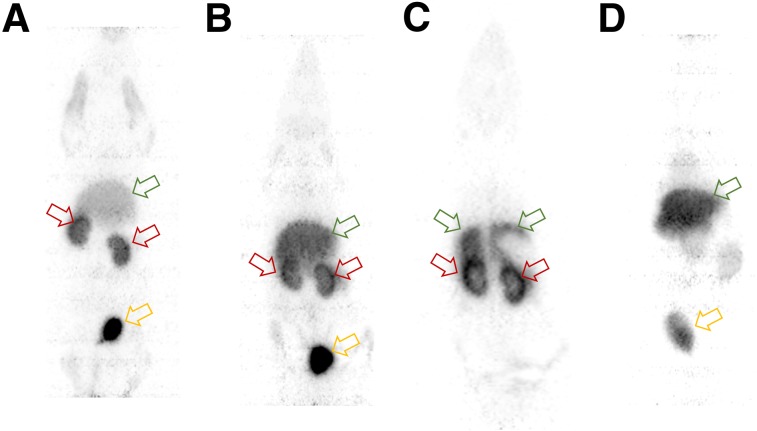
FIGURE 4.
PET images demonstrated receptor-mediated accumulation of 68Ga-IRDye800-tilmanocept in renal cortex (red arrows). (A) Scaled high molar dose study demonstrated low liver accumulation (green arrow) compared with kidneys and urinary bladder (yellow arrow). (B) Low molar dose study demonstrated higher liver accumulation and lower kidney accumulation. (C) Coronal cross-sections more clearly delineate activity in renal cortex. (D) Negative control study (maximum-intensity projection) exhibited significantly less radioactivity in kidneys. All images were acquired 20–40 min after injection.

