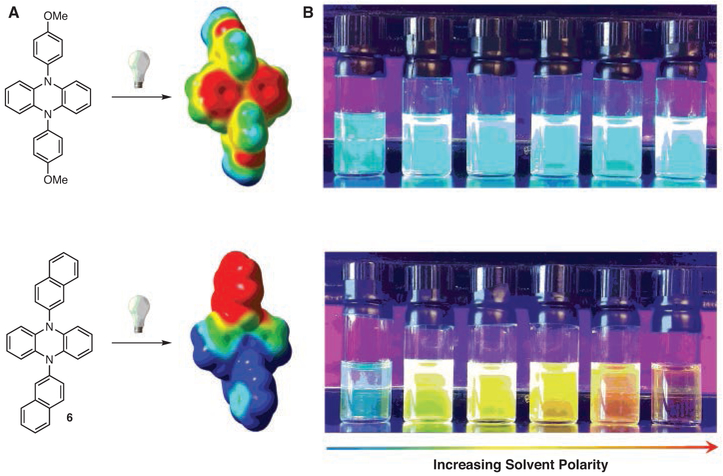
Scheme 5.
Comparison of PhenN’s without (Top) and with (Bottom) CT Excited States. (A) Computed Electrostatic-Potential-Mapped Electron- Density Diagrams Portraying the Distribution of Electron Density within PCs upon Photoexcitation to an Excited State, with Red Signifying Larger Populations of Electron Density. (B) Charge Transfer PCs Exhibit Large Solvatochromic Shifts in Their Emissions in Solvents of Different Polarity, While Non-CT PCs Do Not. Solvents of Increasing Polarity from Left to Right: 1-Hexene, Benzene, Dioxane, THF, Pyridine, and DMF. (Ref. 35,40)

