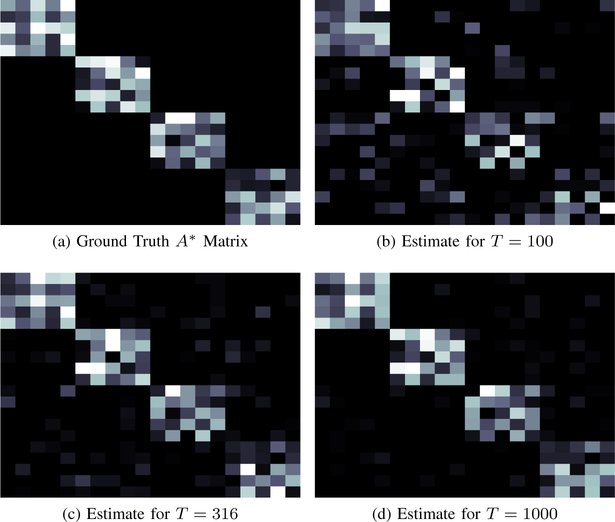
Fig. 2:
These images show the ground truth A* matrix (a) and 3 different estimates of the matrix created using increasing amounts of data. We observe that even for a relatively low amount of data we have picked out most of the support but with several spurious artifacts. As the amount of data increases, fewer of the erroneous elements are estimated. All images are scaled from 0 (dark) to −1 (bright).

