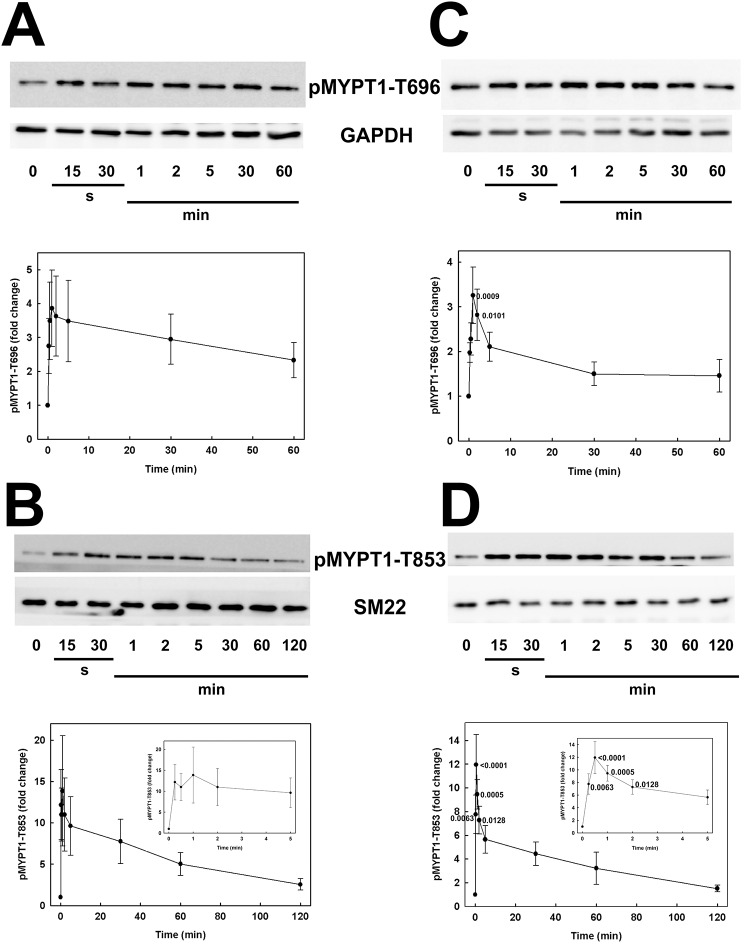
Fig 3. Time courses of serum-induced MYPT1 phosphorylation at T696 and T853 in human arterial smooth muscle cells.
Human coronary (A, B) and umbilical arterial smooth muscle cells (C, D) were treated with serum at time zero, as described in the legend to Fig 1. Cells were lysed in Laemmli sample buffer at the indicated times and subjected to SDS-PAGE and western blotting with anti-pT696-MYPT1 (A, C) or anti-pT853-MYPT1 (B, D). Representative western blots are shown in each panel above cumulative quantitative data. Phosphorylated MYPT1 (pMYPT1) signals were normalized to GAPDH (A, C) or SM22 (B, D) and expressed relative to the pMYPT1: GAPDH or pMYPT1: SM22 ratio at time zero. Values indicate the mean ± SEM (n = 7 in A; n = 8 in B; n = 6 in C and D). Significant differences from the value at time zero are indicated with their respective p values (Dunnett’s post hoc test). Insets in B and D show the first 5 min of the time courses for greater clarity.

