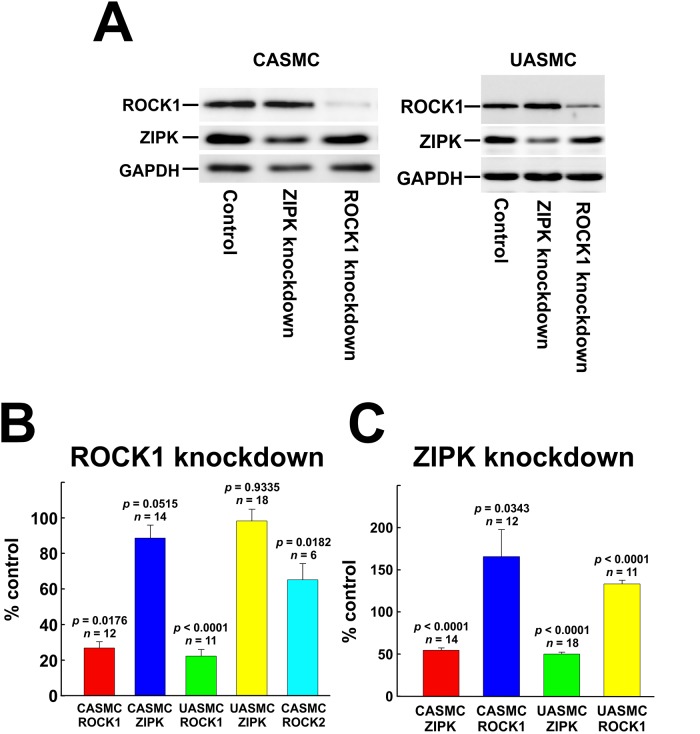
Fig 6. Knockdown of ROCK and ZIPK in cultured vascular smooth muscle cells.
(A) Representative western blots showing the effects of ROCK1 or ZIPK knockdown on ROCK1 and ZIPK expression in CASMC and UASMC. (B) Quantification of ROCK1, ROCK2 and ZIPK levels in ROCK1 siRNA-treated cells compared to controls. (C) Quantification of ROCK1 and ZIPK levels in ZIPK siRNA-treated cells compared to controls. Statistical analysis was carried out with Dunnett’s post hoc test.

