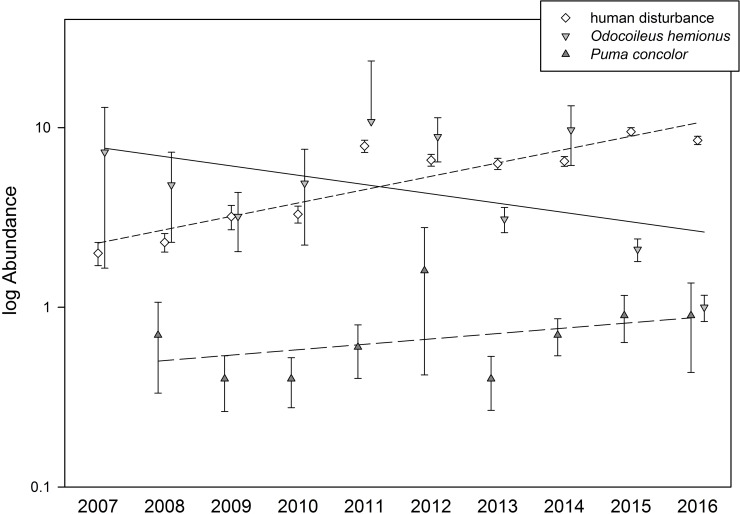
Fig 3. Mean estimated abundance (from an N-mixture model, ±SE, and on a common log scale) of the Mule Deer (Odocoileus hemionus) and Puma (Puma concolor), as well as human disturbance for reference, with heuristic plots of mean slopes from a linear regression.
It is probable (Bayesian posterior P = 0.94) that deer occupancy (Ψ) has decreased over time whereas Puma occupancy has increased (Bayesian posterior P = 0.87). (Occupancy estimates for the Puma were unstable for 2007 and so abundance could not be estimated. Also, probability of detection was not correlated with year, although it may have increased slightly for the deer.).

