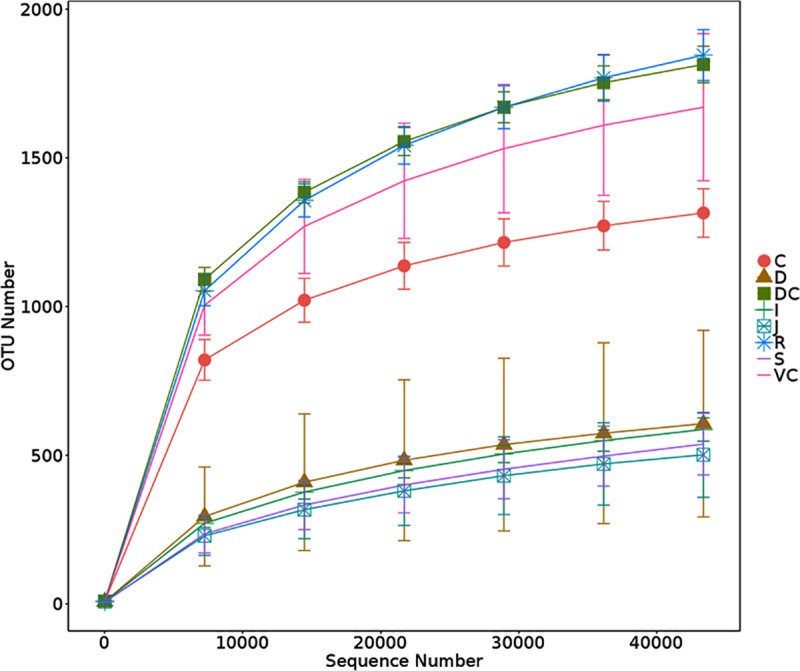
Fig 1. Rarefaction curves of samples.

In the rarefaction curve, the X-axis is the number of sequencing strips which were randomly extracted from a sample, and the Y-axis is the number of OTU constructed based on the number of sequencing strips, which is used to reflect the sequencing depth. Different samples are represented by different color curves. S = stomach, D = duodenum, J = jejunum, I = ileum, C = cecum, VC = ventral colon, DC = dorsal colon, R = rectal. These abbreviations are same in all figures.
