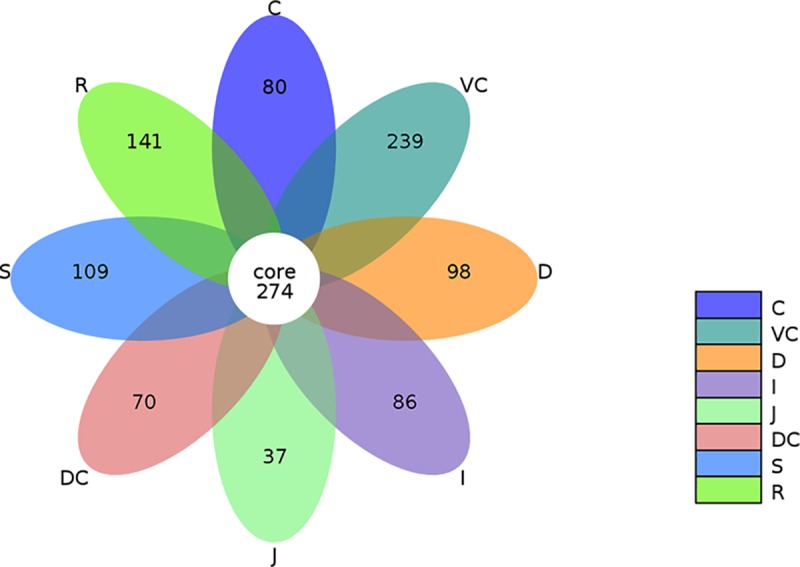
Fig 2. Flower Diagram of OTUs distribution in GIT.

Each petal in the diagram represents a sample, and different colors represent different samples. The core number in the middle represents the total number of mutual OTUs in all samples, and the number on the petal represents the number of unique OTU in this sample.
