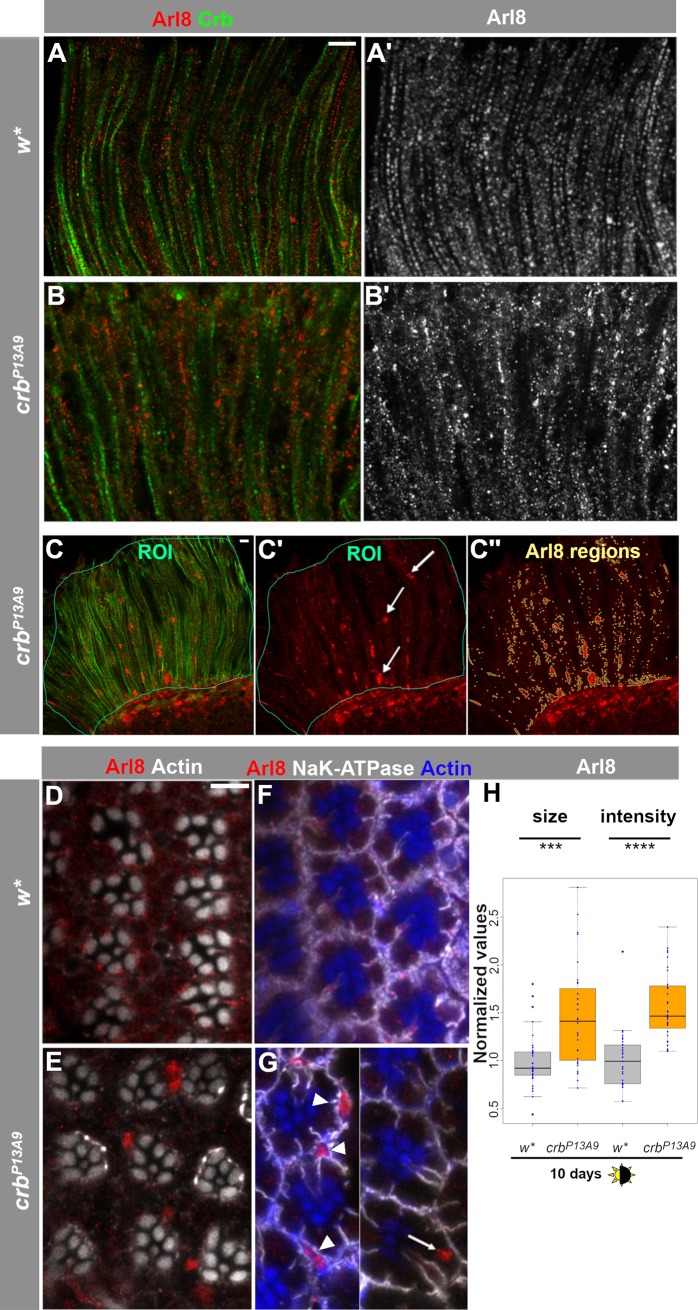
Fig 2. Arl8-positive lysosomal compartments cluster abnormally in crbP13A9 mutant photoreceptor cells under normal light conditions.
(A-B’) Optical longitudinal sections of w* retinas after 5 days of 12h light/12h dark conditions, stained with anti-Arl8 (red) and anti-Crb (green). (C-C”) Depiction of the procedure for quantification of size and intensity of Arl8 regions (see Methods section for details). Areas of longitudinally oriented ommatidia were selected as ROIs (thin teal lines), judged by anti-Crb (green). Arl8-positive regions (red; arrows, C’) within the ROIs were determined by an automatically thresholded Find Maxima plugin to detect signal above background, yielding the “Arl8 regions” outlined in beige (C”). (D, E) Optical cross-sections of w* (D) and crbP13A9 (E) mutant retinas in the same conditions as above show positioning of Arl8 clusters (red) in crbP13A9 with respect to rhabdomeres, which are labelled for actin (white). (F, G) Optical cross-sections of w* (F) and crbP13A9 (G) mutant retinas in the same conditions as above, labelled for basolateral domains (Na+-K+-ATPase; white) and rhabdomeres (actin; blue), where Arl8-positive clusters (red) can be detected in photoreceptors (arrow) and support cells (arrowheads). (G) is a montage from two different images of crbP13A9 rhabdomeres. Scale bar: 5 μm. (H) Comparison of the size and intensity (brightness) of Arl8 regions in w* (grey box plots) and crb P13A9 (orange box plots) retinas, with averaged data from each image stack shown by a dot (for detailed procedure, see Methods). Under 10 days of normal light/dark conditions, Arl8-positive clusters are detected as larger and brighter regions in crb P13A9 retinas (visible in C”), compared to those in w* retinas. Size and brightness values were normalized to w* controls for both groups, and w* and crb P13A9 retinas were always processed in parallel in each experiment. Normalized data from up to three experiments were pooled for each box plot (total n for w* = 26 image stacks, n for crb P13A9 = 24 image stacks). P values for each pairwise comparison were calculated in RStudio using Student’s t-test, and are encoded by stars as follows for this and subsequent plots: * P<0.01; **P<0.001; ***P<0.0001; ****P<0.00001; *****P<0.000001.

