. 2019 Sep 25;8:e48221. doi: 10.7554/eLife.48221

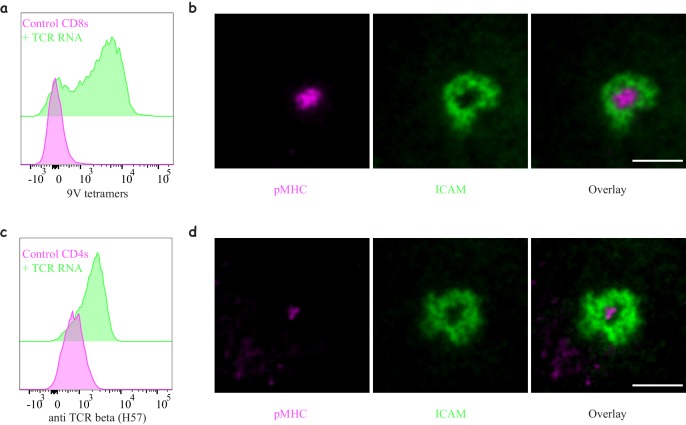
Figure 2. Engineering antigen-specific T-cells.

(a) Expression of 1G4 TCR in naïve CD8 T-cells upon mRNA electroporation detected using NY-ESO-9V/HLA-A2 tetramer,~80% positive (Representative of N = 13). (b) Formation of an immunological synapse by 1G4-expressing naïve CD8 T-cells on supported lipid bilayers (SLBs) with cSMAC enriched with NY-ESO-9V/A2 pMHC (magenta) surrounded by an LFA1/ICAM1 ring (green). Representative of >3 independent repeats. (c) Expression of 6F9 TCR in naïve CD4 T-cells detected using an antibody against the constant region of mouse TCRβ,~67% positive (Representative of N = 15). (d) Formation of an immunological synapse by 6F9-expressing naïve CD4 T-cells on SLB containing MAGE/DP4 pMHC (magenta). Representative of >3 independent repeats. Scale bars = 5 μm.

Figure 2—source data 1. TCR expression following mRNA electroporation.

Figure 2.

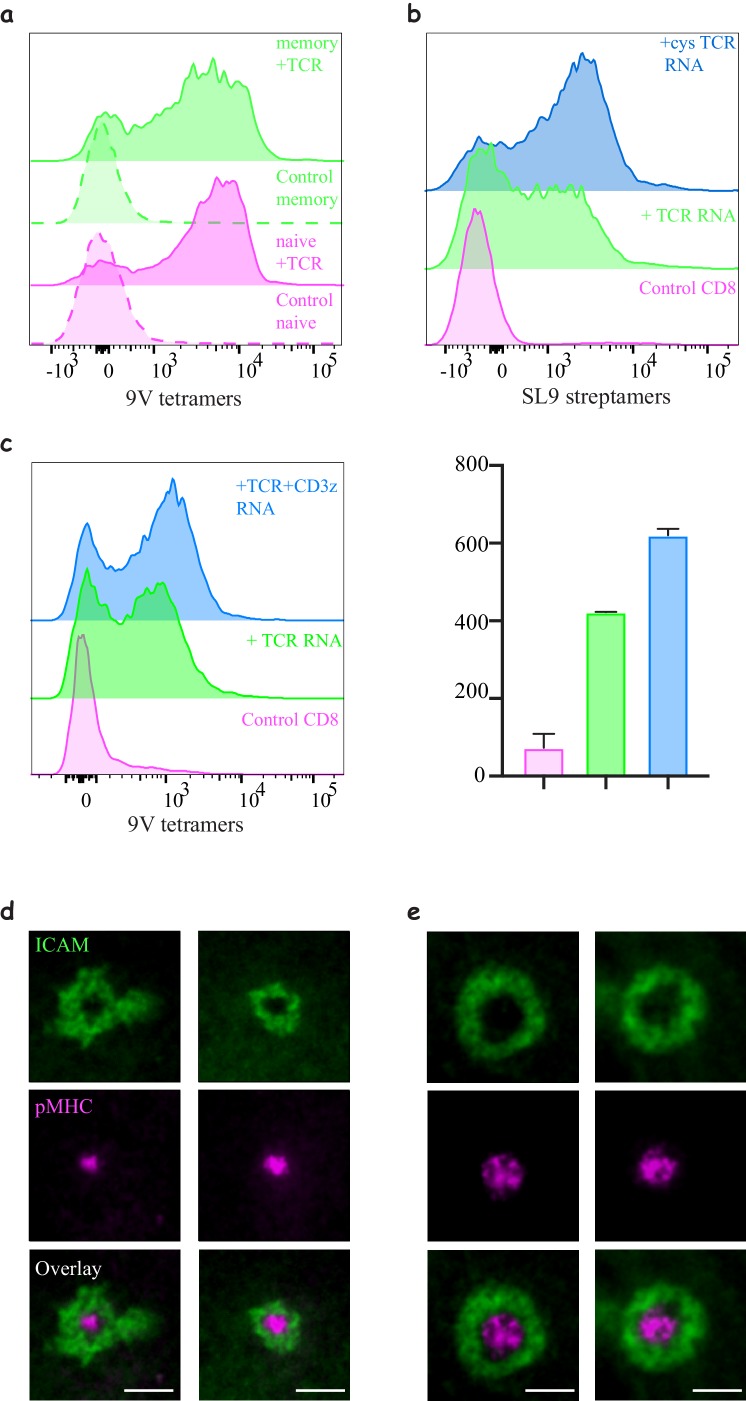
Figure 2—figure supplement 1. Engineering CD8 T-cells with different TCR constructs.

Figure 2—figure supplement 1.

(a) Expression of 1G4 in naïve and memory CD8 T-cells. Expression was comparable, although we noticed a slightly lower expression levels in memory T- cells. (b) Expression of 868 TCR using mRNA electroporation. Also note the improved efficiency after introducing the cysteine modification. Data shown are representative of at least three independent donors for the 868 without and with the cystine modification. Similar results were achieved for 1G4. (c) Histograms of TCR expression following mRNA electroporating of the alpha and beta chains with or without the addition of CD3ζ (right) and quantification of the mean fluorescent intensity (left). Note the increase in efficiency (Representative of N > 3). (d–e) Formation of an immunological synapse by 1G4-expressing naïve (d) and activated (e) CD8 T-cells on supported lipid bilayers (SLBs) with cSMAC enriched with NY-ESO-9V/A2 pMHC (magenta) surrounded by LFA/ICAM1 ring (green).
Figure 2—figure supplement 2. Functional response of mRNA electroporated T-cells.

Figure 2—figure supplement 2.

(a) Dose response curve of percent positive (left) and geometric mean (right) of 1G4-expressing naïve (black) or memory (grey) CD8 T-cell upregulating CD69 upon stimulation with peptide loaded acDC, both with low (NY-ESO-4D) and high (NY-ESO-9V) affinity peptides. (b) Dose response curve of naïve CD4s expressing MHC-II restricted TCRs upon stimulation with peptide loaded acDC with either MAGE-A3243-258 (for 6F9 and R12C9) or NY-ESO157-180 (for SG6). T-cells and DCs are at 1:1 ratio.
Figure 2—figure supplement 3. Efficiency of electroporation and cell recovery using different methods.

Figure 2—figure supplement 3.

Naïve T-cells electroporated with an mRNA for the fluorescent protein Ruby. (a) Percentage of Ruby positive cells following electroporation using three different commercially available electroporators: BTX, Amaxa from Lonza and Neon from ThermoFisher. U-14, V-23 and T-23 are electroporation setting on the Amaxa machine. 1700 and 2150 are the voltages used on the Neon (see Materials and methods for more details). (b) Number of cell recovered following electroporation- a product of cell viability and cell count compared to starting condition (dashed grey line).
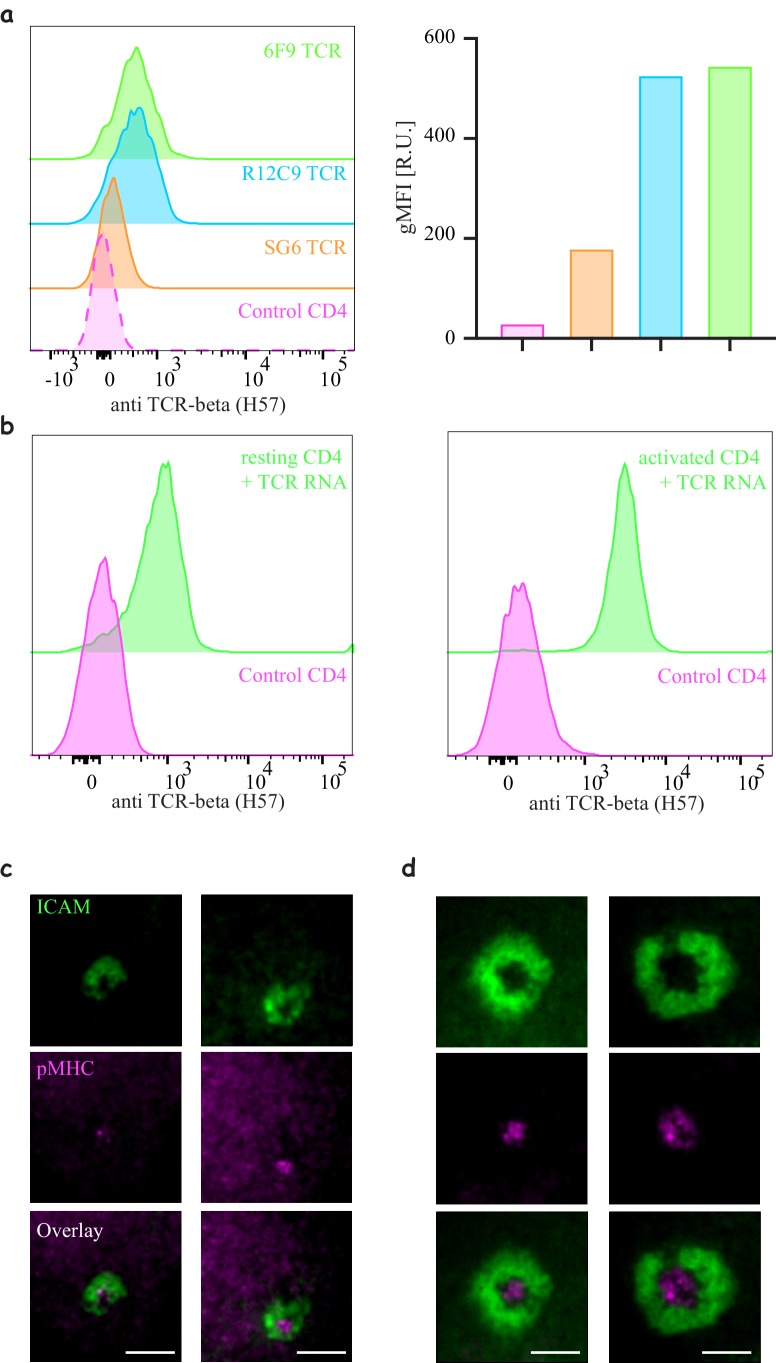
Figure 2—figure supplement 4. Engineering CD4 T-cells with different TCR constructs.

Figure 2—figure supplement 4.

(a) Histograms of TCR expression of three MHC-II restricted TCRs (6F9, R12C9 and SG6) (right) and mean quantification of the mean fluorescent intensity (left). Note similar efficiency for 6F9 and R12C9 compared to significantly lower efficiency of SG6) (Representative of N > 3). (b) Expression of 6F9 TCR by electroporation of naïve (left) or expanded (right) CD4 T-cells (similar results are obtained for R12C9 and SG6). (c–d) Formation of an immunological synapse by 6F9 expressing naïve (d) and activated (d) CD8 T-cells on supported lipid bilayers (SLBs) with cSMAC enriched with 9V/A2 pMHC (magenta) surrounded by LFA/ICAM1 ring (green).
Figure 2—figure supplement 5. Interactions of 1G4-expressing naïve CD8 T-cells with pMHC presented on spatially segregated stimulatory spots.

Figure 2—figure supplement 5.

(a) The average speed of naïve CD8 T-cells moving on the micropatterned surfaces that have not yet attached to a stimulatory spot (Video 1). This is essentially indistinguishable from the speed of untouched naïve CD8 T-cells in an analogous setting (Mayya et al., 2015) (b) The number of cells arresting on spots as a function of time. Gradual accumulation of arrested cells is an indication of efficient search by the T-cells and induction of arrest due to TCR-pMHC interactions. The attachment profile is comparable to that of untouched cells engaging with anti-CD3 stimulatory spots (Mayya et al., 2019). (c) The number of remaining attached cells on stimulatory spots as a function of time after the first 40 min of imaging. The linear fit allows the extraction of the life-time of the interactions. Half-life of 4.6 hr compares well with that of untouched cells engaging with anti-CD3 spots (Mayya et al., 2018).