. 2019 Sep 25;8:e48221. doi: 10.7554/eLife.48221

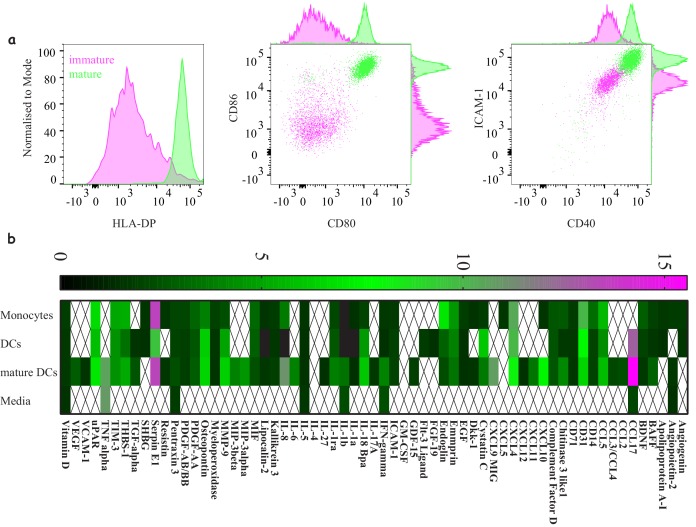
Figure 3. Characterising ‘express’ dendritic cells as a model antigen presenting cell.

(a) Activation and differentiation profile of ‘express’ monocyte-derived dendritic cells: mature cells (green) upregulate their antigen presentation and costimulatory molecules compared to immature cells (magenta). Representative of >3 independent repeats. (b) Cytokine and chemokine secretion profile from monocytes, dendritic cells and mature dendritic cells using the 48 hr express protocol. Average values for three donors where signals bellow 1.5-fold above background were not included.

Figure 3—source data 1. Cytokine production by classical DC.

Figure 3.

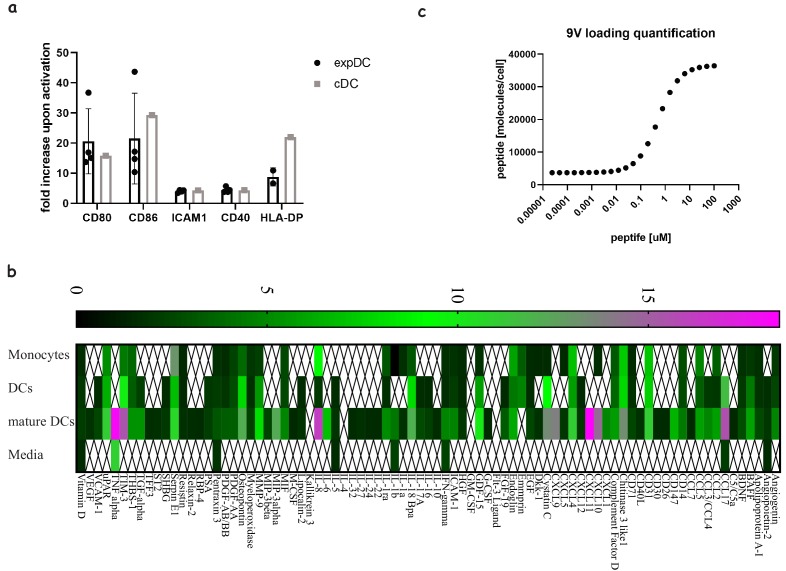
Figure 3—figure supplement 1. Comparing ‘express’ and ‘classical’ monocyte-derived dendritic cells.

Figure 3—figure supplement 1.

(a) The degree of costimulatory molecule upregulation upon maturation for classical and express DCs. (b) Analysis of fold production of cytokines and chemokines released from classical DCs generated in 7 day differentiation and maturation protocols at different stages: monocytes, differentiated DCs and matured/activated DCs. An average of three donors where signals bellow 1.5-fold above background were not included. (c) Quantification of the number of NY-ESO-9V peptides loaded on DCs using soluble high affinity TCR (c113) and MSEF calibration beads.