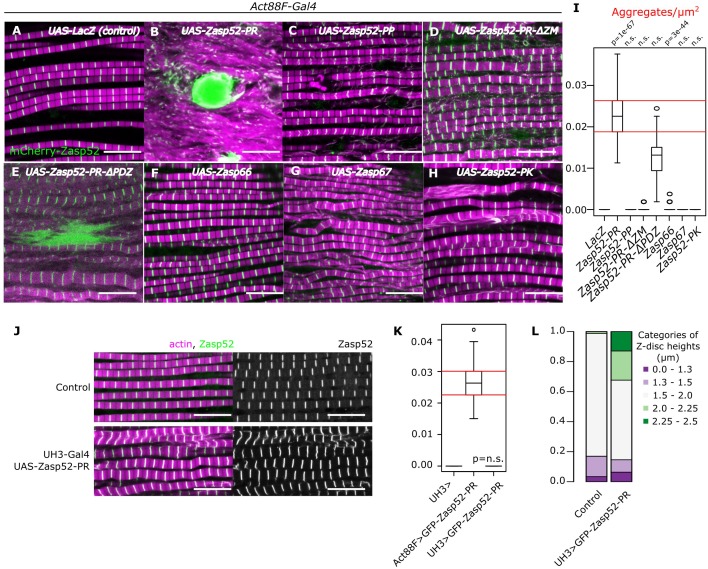
Figure 1. Aggregate formation upon Zasp overexpression.
(A–H) Confocal images of IFM in control or Zasp overexpression conditions using Act88F-Gal4; actin filaments are marked in magenta and Z-discs in green. (A) In control flies, sarcomeres are regular with Z-discs located in the center of the actin signal. (B) Upon GFP-Zasp52-PR overexpression sarcomere structure is severely affected and big Zasp aggregates appear. (C) The overexpression of Flag-Zasp52-PP, an isoform lacking all LIM domains, has a modest sarcomere phenotype and aggregation is not observed. (D) Overexpression of a mutated form of Zasp52-PR with a deletion in the ZM domain does not form aggregates. (E) Overexpression of a mutated form of Zasp52-PR carrying a deletion in the PDZ domain causes small aggregates and sarcomere phenotypes. (F and G) The overexpression of the other Zasp paralogs, Zasp66 or Zasp67, does not cause aggregates. (H) Overexpression of GFP-Zasp52-PK, a smaller isoform of Zasp52 lacking LIM2, 3, and 4 domains affects sarcomere structure, but aggregation is infrequent. (I) Estimation of Z-disc aggregates in all overexpression conditions, n = 10 muscle fibers. (J) Confocal images of IFM in control or in mild overexpression of GFP-Zasp52-PR using UH3-Gal4. (K) Estimation of Z-disc aggregates in mild overexpression of GFP-Zasp52-PR. (L) Frequency plot of Z-disc sizes. Z-discs are bigger when GFP-Zasp52-PR is overexpressed using UH3-Gal4. Scale bars, 10 µm. p-Values in panel I and K were calculated using Welch’s two-sample t-test.


