. 2019 Nov 20;8:e50496. doi: 10.7554/eLife.50496

Figure 3. Zasp interaction in vivo at the Z-disc.

(A–C) Confocal images of Zasp66-GFP IFM in control and Zasp52 mutant backgrounds. Zasp66-GFP levels are lower in Zasp52MI00979 mutant than in the control or in Zasp52MI02988 mutants. (D) Boxplot of Zasp66-GFP intensities in control and Zasp52 mutant backgrounds. (E, F) Examples of a negative BiFC control (F) and a positive BiFC signal (E) suggesting Zasp52-PK dimerizes at the Z-disc. (G, H) Plots of the BiFC fluorescence intensity values relative to background noise. Positive BiFC fluorescence is detected between Zasp52-PK and Zasp52-PK (G) and between Zasp52-PK and Zasp66-PH (H). Act88F-Gal4 was used to drive expression of NYFP- or CYFP-tagged proteins. Scale bar, 5 µm. p-Values in panels D, G, and H were calculated using Welch’s two-sample t-test.

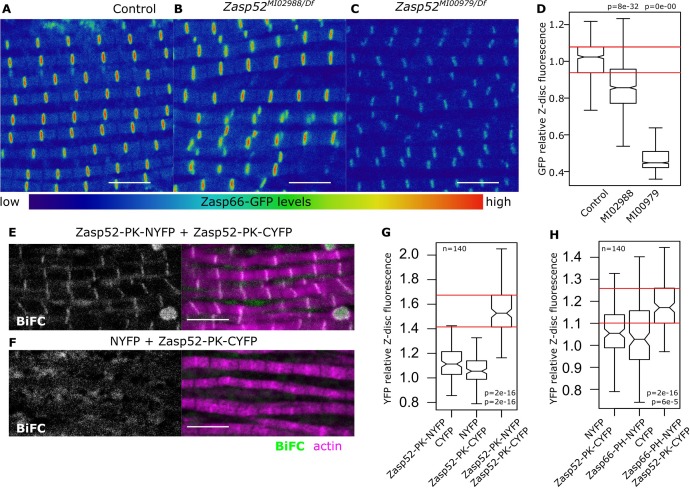
Figure 3—source data 1. Zasp66 levels and BiFC values.

Figure 3.

Figure 3—figure supplement 1. Zasp52 gene map and BiFC.

Figure 3—figure supplement 1.

(A) Cartoon representing the Zasp52 genomic locus with selected transcripts, two alternative transcription start sites, protein domains, and three MiMIC lines introducing an artificial exon which consists of a splice acceptor followed by stop codons for all three reading frames. (B) Confocal images of Actn-GFP IFM in control and Zasp52 mutant backgrounds. Actn-GFP levels are comparable between the control and Zasp52 mutants. (C) Boxplot of Actn-GFP intensities in control and Zasp52 mutant backgrounds. p-Values were calculated using one-sided Welch’s two-sample t-test. (D) Representation of the BiFC principle. (E) The ZM-only Zasp66-PH isoform tagged with a Venus fluorescent protein localizes to the Z-disc, marked by Zasp52-mCherry.