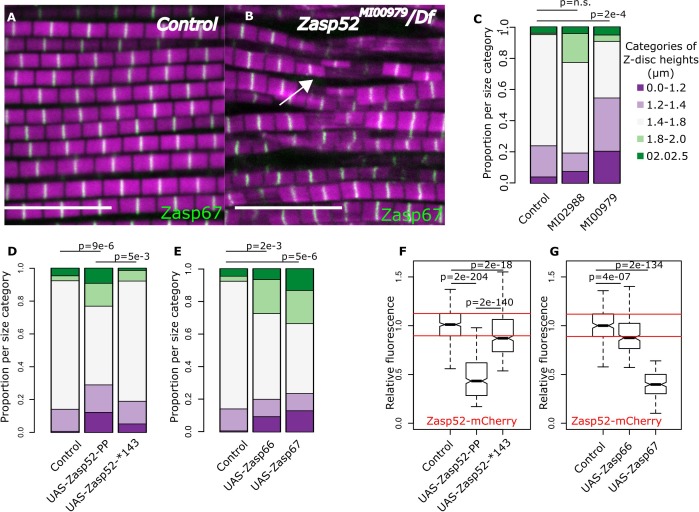
Figure 6. Balance of isoforms dictates Z-disc size.
(A and B) Confocal microscopy images of control and Zasp52MI00979 mutant. Actin filaments are marked in magenta and Z-discs in green. The Zasp52MI00979 mutant has smaller and frayed Z-discs. (C) Frequency plot of Z-disc sizes in control, Zasp52MI02988, and Zasp52MI00979 mutants. Small Z-discs are only observed in the Zasp52MI00979 mutant. (D) Overexpression of the Zasp52-PP blocking isoform also results in smaller Z-discs. The small Z-disc phenotype is not observed in Zasp52-Stop143, lacking the ZM domain. (E) Small Z-disc phenotypes are observed upon overexpression of Zasp66 and Zasp67. (F and G) Boxplots of the Zasp52 fluorescence intensities upon overexpression of different blocking isoforms. (F) Zasp52-mCherry levels decrease upon overexpression of Zasp52-PP but are restored if the ZM domain of Zasp52-PP is deleted (Zasp52-*143). (G) Zasp52-mCherry levels also decrease upon overexpression of Zasp66 and Zasp67. Act88F-Gal4 was used for overexpression experiments in panels D-G. Scale bars, 5 µm. p-Values in panels C-E were calculated using Fisher's exact test for count data. p-Values in panels F and G were calculated using Welch’s two-sample t-test.


