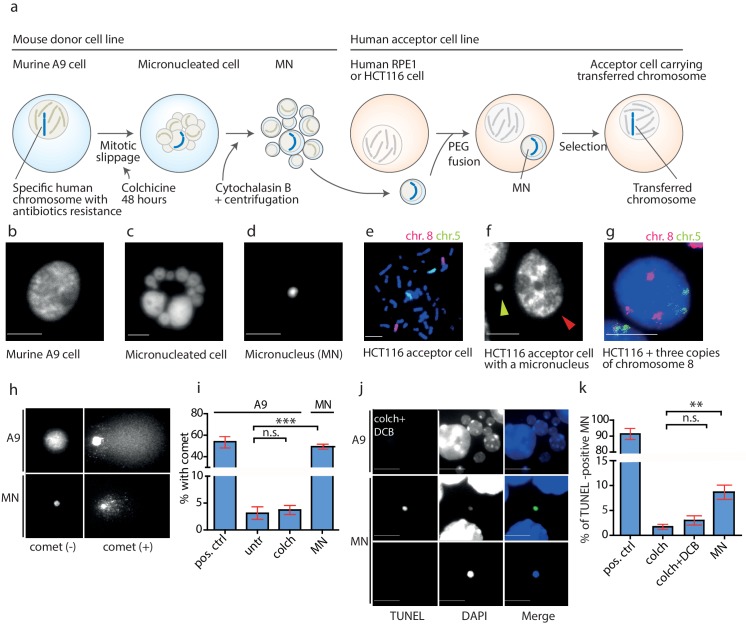
Figure 2. DNA damage in isolated micronuclei after mitotic slippage.
(a) Schematic depiction of MMCT. (b) Murine A9 cell before micronucleation. (c) Formation of micronuclei in the A9 donor cell upon colchicine treatment. (d) Microcells with micronucleus isolated via centrifugation. (e) Chromosome painting with probes for chromosome 5 (green) and chromosome 8 (red) in HCT116 before fusion. (f) Micronucleus (yellow arrowhead) next to the primary nucleus in the acceptor cell (HCT116, red arrowhead). (g) Chromosome painting of interphase nuclei in trisomic HCT116. (h) Examples of nucleus of an A9 cell and isolated MN without (-) and with (+) DNA apparent comet. DNA was stained with DAPI. (i) Quantification of cells with a comet in untreated cells (untr), cells treated with colchicine for 48 hr (colch) and in isolated MN. Doxorubicin treated A9 cells were used as a positive control (pos. ctrl). All plots show mean ± s.e.m. of three independent experiments; at least 100 nuclei or MN were scored in each experiment. T-test; p<0.0005. (j) Examples of TUNEL assay in A9 cells treated with colchicine for 48 hr followed by 30 min cytochalasin B (colch+DCB) and in isolated MN. DNA was stained with DAPI. (k) Quantification of TUNEL positive MN under conditions as in (c). All plots show mean ± s.e.m. of at least three independent experiments. N: pos. ctrl = 213, colch = 660, colch+DCB = 137, MN = 2003. T-test; p<0.005. Scale bar: 10 μm.


