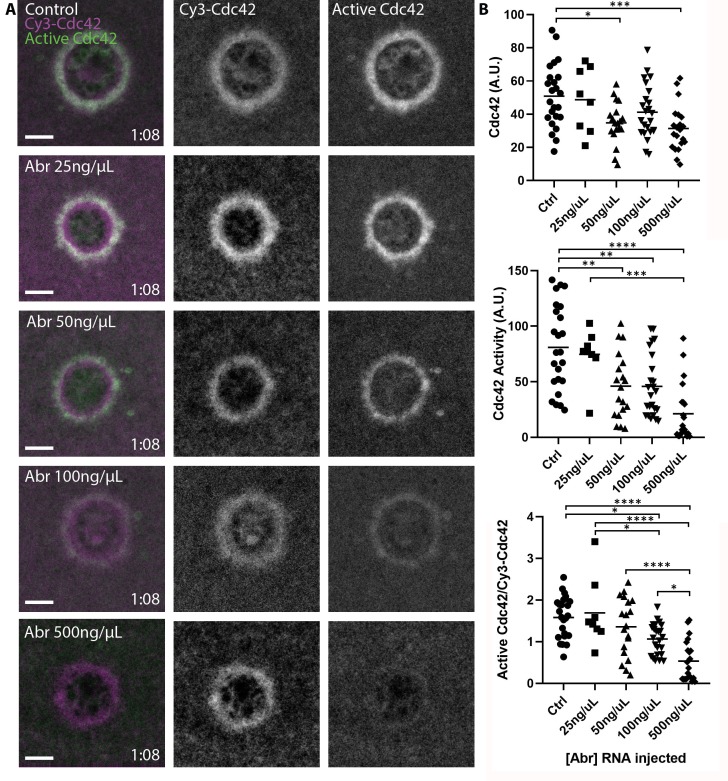
Figure 3. Pools of inactive and active Cdc42 at the plasma membrane.
(A) Oocytes microinjected with wGBD (green), Cy3-Cdc42 (magenta) and indicated concentrations of mRNA encoding the Cdc42-GAP Abr. Scale bar 10 μm, time min:sec.; (B) Quantification of Cy3-Cdc42, active Cdc42 and ratio of active Cdc42 to Cy3-Cdc42 for each condition. n = 8–24. One-way ANOVA with Tukey post-test statistical analysis. *p<0.05, **p<0.01, ***p<0.001, ***p<0.0001.

