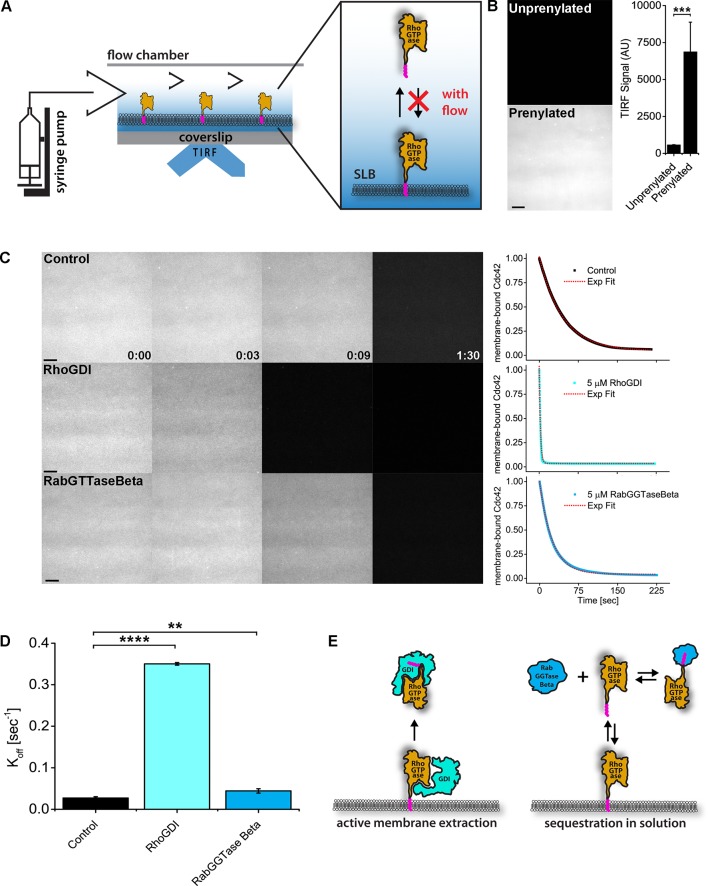
Figure 6. RhoGDI extracts RhoGTPases from membranes in vitro.
(A) Experimental setup of in vitro experiments: prenylated RhoGTPases were reconstituted on supported lipid bilayers (SLBs) in flow chambers and imaged by TIRF. Wash off experiments were designed to avoid RhoGTPase rebinding to membranes and performed controlling the flow rate via a syringe pump; (B) TIRF imaging allows for selective imaging of RhoGTPases at the membrane. Prenylated and unprenylated Cdc42 were imaged in the same conditions and TIRF signal at membranes was quantified (n = 4 for each condition); (C) Wash off experiments: prenylated Cdc42 reconstituted on SLBs were washed with imaging buffer only (control), in presence of 5 μM RhoGDI or RabGTTase Beta. Time lapse images at selected time points and quantification of the full experiments are shown. Decay curves were fitted with a monoexponential function; (D) Comparison of the Koff values obtained by fitting the decay curves (n = 3 for control and RabGTTase Beta, n = 2 for RhoGDI); (E) Schematic representation of the proposed mode of action of the two RhoGTPases solubilizers. RabGGTase Beta sequesters RhoGTPases in solution, whereas RhoGDI actively extracts RhoGTPases from the membranes. Scale bar 10 μm. Unpaired student’s t-test, 2-tailed distribution, equal variance statistical analysis. **p<0.01, ***p<0.001, ****p<0.0001.
Figure 6—figure supplement 1. In vitro data analysis.
Figure 6—figure supplement 2. Purified RhoGDI protein.


