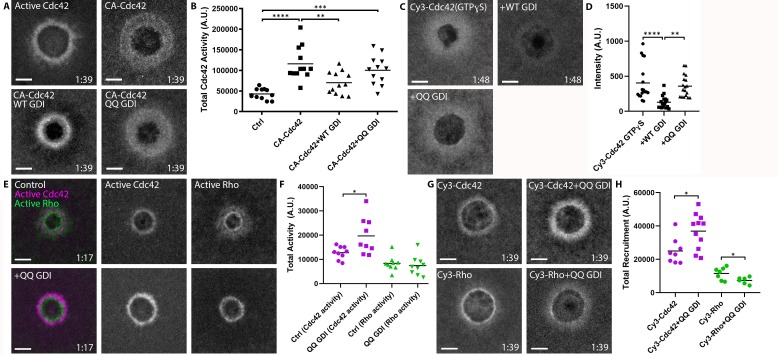
Figure 9. RhoGDI extracts active Cdc42 in vivo.
(A) Oocytes microinjected with wGBD alone or with constitutively-active Cdc42 (CA:G12V), WT or QQ GDI; B) Quantification of total Cdc42 activity for (A), (n = 12); C) oocytes microinjected with Cy3-Cdc42 bound to GTPɣS alone or with WT or QQ GDI; D) Quantification of intensity for (C), (n = 18). Scale bar 10 μm, time min:sec. One-way ANOVA with Tukey post-test statistical analysis; E) Oocytes microinjected with wGBD (magenta), rGBD (green) alone or with QQ GDI; F) Quantification of total Cdc42 (magenta) and Rho (green) activity from (E) (n = 9); G) Cy3-Cdc42 or Cy3-Rho alone or with QQ GDI; H) Quantification of total recruitment of Cy3-Cdc42 (magenta) and Cy3-Rho (green) (n = 6–11). Scale bar 10 μm, time min:sec. Unpaired student’s t-test, 2-tailed distribution, unequal variance statistical analysis. *p<0.05, **p<0.01, ***p<0.001, ***p<0.0001.
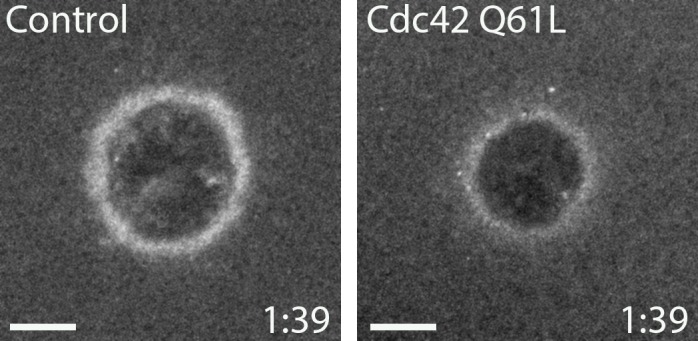
Figure 9—figure supplement 1. Cdc42 Q61L does not behave like constitutively-active Cdc42 in vivo.


