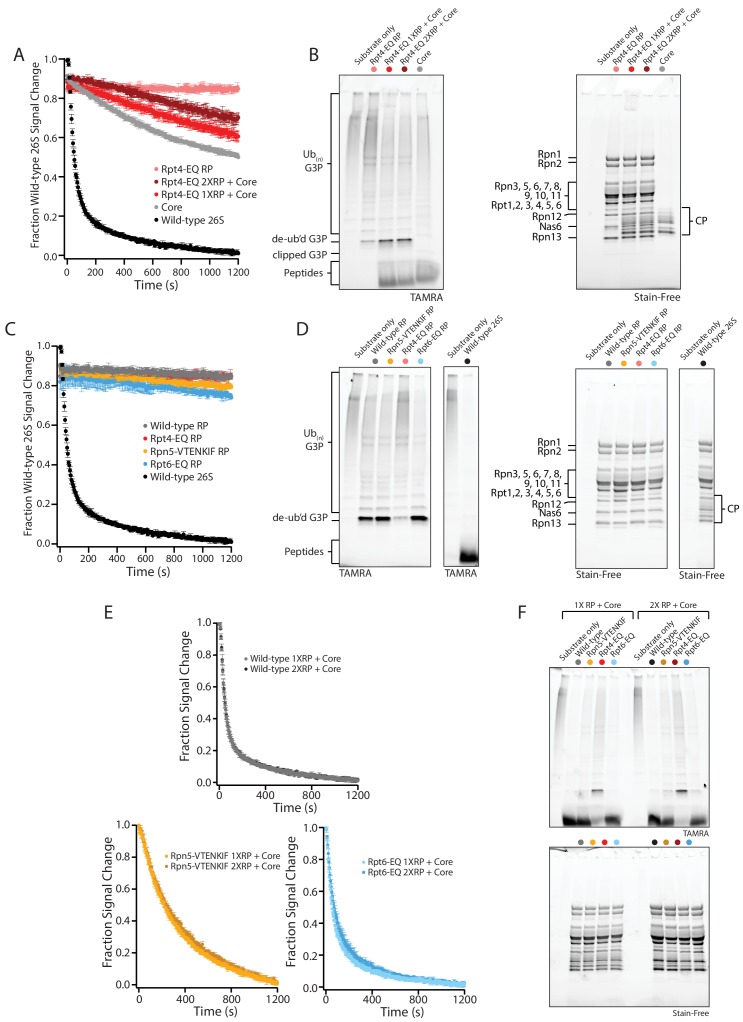
(A) Normalized fluorescence anisotropy measurements showing the processing of ubiquitinated TAMRA-G3P-substrate by reconstituted Rpt4-EQ regulatory particle (RP) alone, by proteasomes reconstituted with Rpt4-EQ regulatory particle at stoichiometric amounts (2RP:1CP = 1X RP + Core) or in two-fold access (4RP:1CP = 2X RP + Core), and by core particle alone, normalized to the degradation by reconstituted wild-type 26S proteasome (N = 3; error presented = SD). (B) SDS-PAGE analysis of end-point samples from single-turnover degradation reactions performed in (A), visualizing the fluorescence of TAMRA-labeled G3P-substrate (left) and total protein at (right). (C) Normalized fluorescence anisotropy measurements showing the processing of ubiquitinated TAMRA-G3P-substrate by proteasomes reconstituted with mutant regulatory particles, normalized to reconstituted wild-type 26S proteasome. (N = 3; error present = SD). (D) SDS-PAGE analysis of end-point samples from single-turnover degradation reactions performed in (C), visualizing the fluorescence of TAMRA-G3P-substrate (left) and total protein (right). (E) Normalized fluorescence anisotropy measurements showing the processing of ubiquitinated TAMRA-G3P-substrate by wild-type, Rpn5-VTENKIF-, and Rpt6-EQ-mutant proteasomes reconstituted with a stoichiometric amount (2RP:1CP = 1 XRP) or two-fold excess of RP (4RP:1CP = 2 XRP). (N = 3, error presented = SD). (F) SDS-PAGE analysis of end-point samples from single-turnover degradation reactions performed in (D), visualizing the fluorescence of TAMRA G3P-substrate (top) and total protein (bottom).
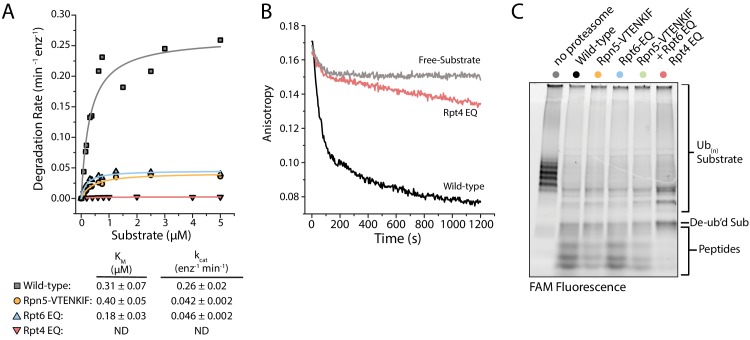
Figure 4—figure supplement 1—source data 1. Source data for Michaelis-Menten analyses of substrate degradation by wild-type, Rpn5-VTENKIF, Rpt4-EQ, and Rpt6-EQ mutant proteasomes, and source data for substrate processing by the corresponding regulatory particles.


