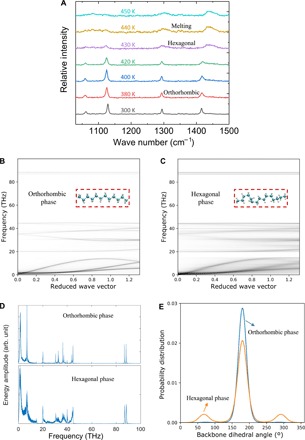
Fig. 4. Micro-Raman measurements and MD simulations of PE nanofibers before and after the phase transition.

(A) Temperature-dependent micro-Raman measurements of a PE nanofiber. All Raman spectra are normalized with respect to the intensity of the Raman peak at ~1128 cm−1 at 300 K. (B and C) Phonon dispersions of the orthorhombic phase and the hexagonal phase of a PE nanofiber. The less blurry (cleaner) lines of the phonon dispersion in (B) suggest less phonon scattering. (D) Corresponding vibrational power spectra at the reduced wave vector value of k = 0.33. (E) Corresponding dihedral angle θ distributions.
