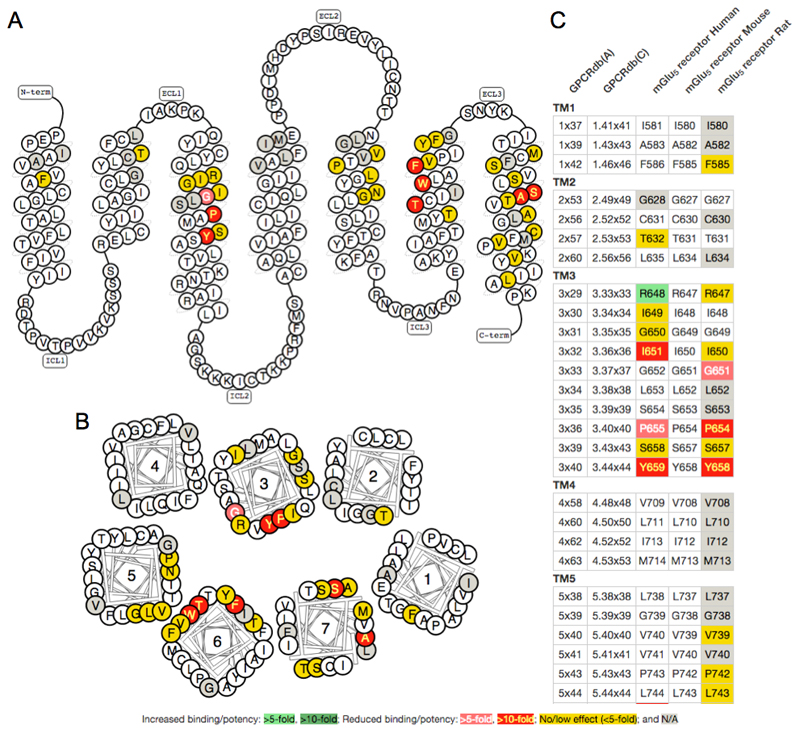
Figure 3.
Visualisation of mutations with effect on ligand binding/potency at the mGlu5 receptor. A) Snake and B) helix box diagrams visualise the receptor topology as seen from the side and above, respectively. C) Residue Tables give a side-by-side comparison of receptor species orthologues. The colour scheme indicates the fold effect of mutation on ligand binding, as described in the label. The figures were obtained from the GPCRdb mutation browser [9].

