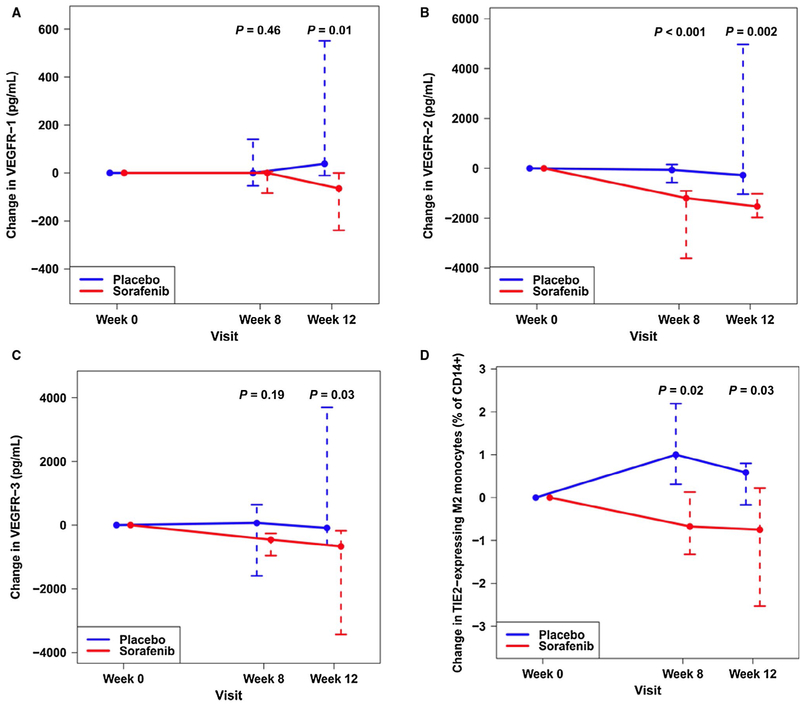
FIG. 4.
Median (whiskers, IQR) absolute change in circulating (A) VEGFR-1 (pg/mL), (B) VEGFR-2 (pg/mL), (C) VEGFR-3 (pg/mL), and (D) TIE2-expressing M2 monocytes (% of CD14+ cells) from baseline to 8 and 12 weeks in patients receiving sorafenib (red) or placebo (blue). P values are for comparison with baseline.

