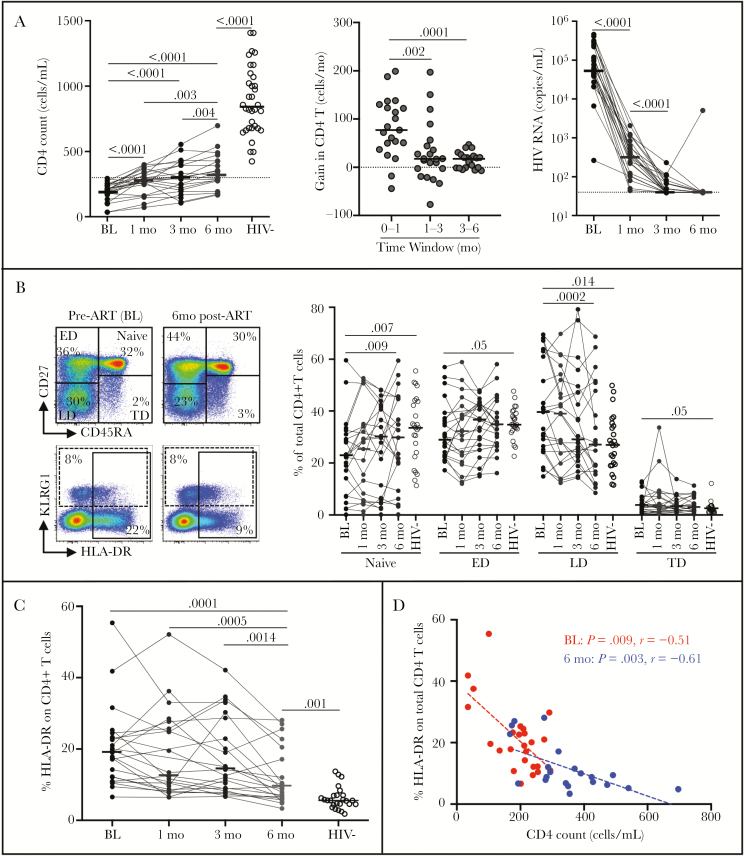
Figure 1.
Reconstitution of the CD4 compartment during the first 6 months of antiretroviral therapy (ART) in HIV-1 infected patients (n = 23). A, Evolution of absolute CD4 count at baseline (BL, pre-ART), 1, 3, and 6 months’ ART; gain in total CD4 T cells/month; and evolution of plasma HIV viral load. Horizontal lines indicate the median and P values are given. B, Memory profile of total CD4 T cells from BL to 6 months’ ART. Representative flow plots (left) indicate CD4 T-cell subset distribution and cell activation analysis. Naive cells were defined as CD45RA+CD27+, early differentiated (ED) as CD45RA−CD27+, late differentiated (LD) as CD45RA−CD27−, and terminally differentiated (TD) as CD45RA+CD27−. C, Expression of HLA-DR in total CD4 T cells during ART. Horizontal bars represent the median values. D, Relationships between HLA-DR expression in total CD4 T cells and CD4 count at baseline and 6 months’ ART. All statistical comparisons between groups were performed using the nonparametric Mann-Whitney test and correlations were assessed using a 2-tailed nonparametric Spearman rank correlation.

