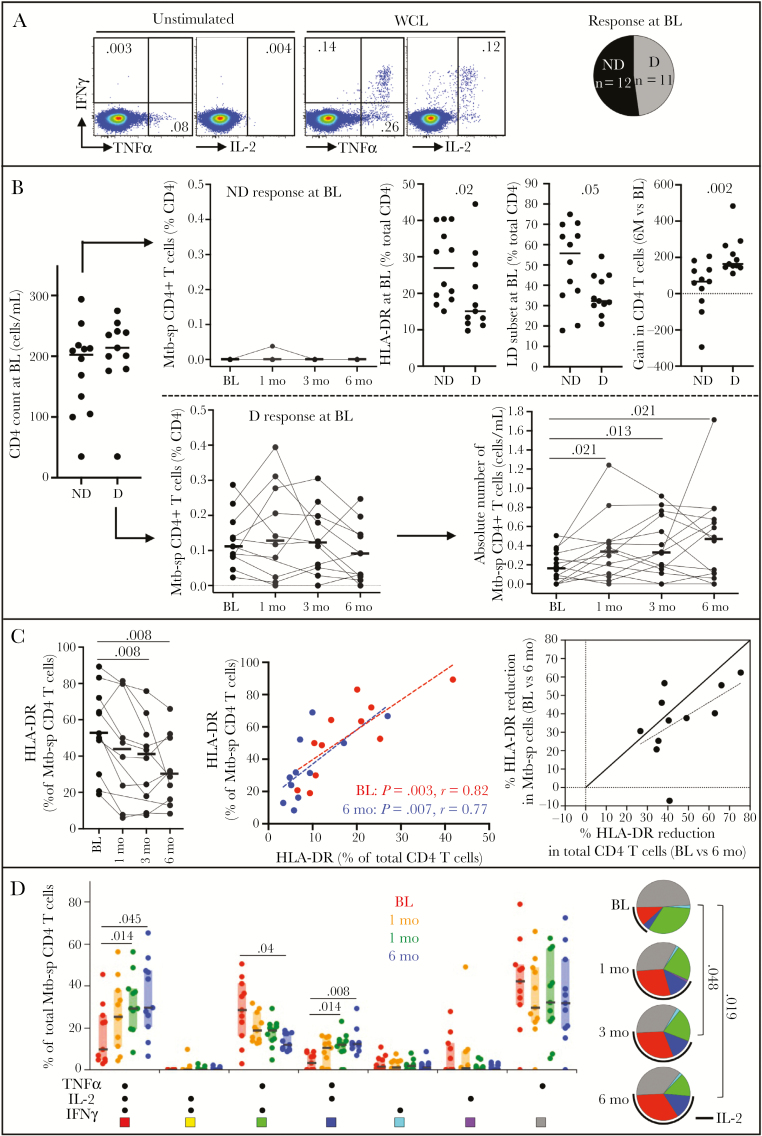
Figure 2.
Evolution of Mycobacterium tuberculosis-specific CD4 T cells during the first 6 months of antiretroviral therapy (ART) in HIV-1 infected patients (n = 23). A, Representative flow plots of interferon-γ (IFN-γ), tumor necrosis factor-α (TNF-α), and interleukin-2 (IL-2) production in response to M. tuberculosis whole-cells lysate (WCL) and distribution of number of individuals exhibiting a detectable (D) or nondetectable (ND) response to M. tuberculosis WCL using flow cytometry at baseline (BL). B, Evolution of M. tuberculosis-specific (Mtb-sp) CD4 T-cell responses to ART in individuals with a detectable (D, n = 11) or nondetectable (ND, n = 12) M. tuberculosis response at BL. Comparison of the activation and memory profile of total CD4 T cells and CD4 cell gain (BL vs 6 months) between individuals with a detectable (D) or nondetectable (ND) M. tuberculosis response. C, HLA-DR profile in M. tuberculosis-specific CD4 T cells from baseline to 6 months ART and relationship with overall CD4 T-cell activation. D, Polyfunctional profile M. tuberculosis-specific CD4 T cells producing any possible combination of IFN-γ, TNF-α, and IL-2. Each slice of the pie corresponds to a distinct combination of cytokine. A key to colors in the pie charts is shown below the graph and the arc corresponds to the proportion of cells producing IL-2. Horizontal bars and boxes represent the median values and interquartile range, respectively. All statistical comparisons between groups were performed using a nonparametric Mann-Whitney test and correlations were assessed using the 2-tailed nonparametric Spearman rank correlation, and P values are given.

