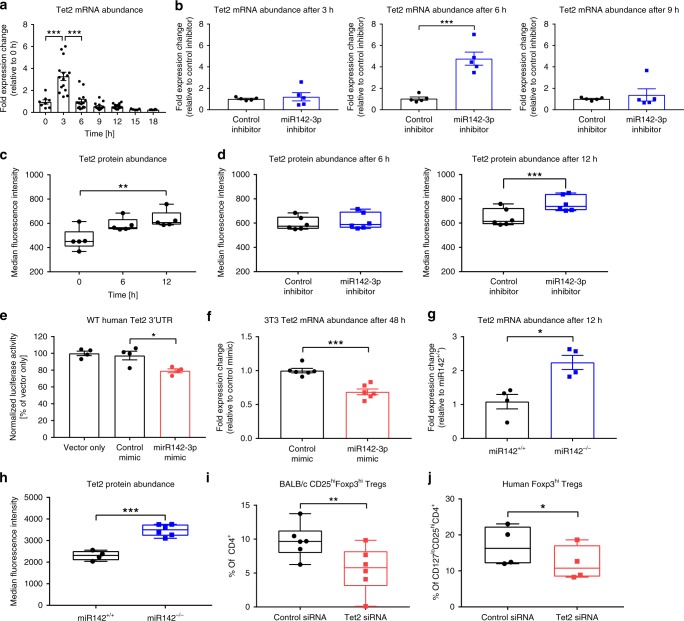
Fig. 5. miR142-3p targets methylcytosine dioxygenase Tet2.
a Levels of Tet2 mRNA after TCR stimulation of CD4+ T cells isolated from lymph nodes of BALB/c mice, as revealed by qPCR normalized to Histone mRNA, n ≥ 8. b Levels of Tet2 mRNA after TCR stimulation of CD4+ T cells as described in a, in presence of miR142-3p inhibitor, as revealed by qPCR normalized to Histone mRNA, n = 5. c Tet2 protein abundance after TCR stimulation of CD4+ T cells as described in a, as revealed by flow cytometry, n = 5. d Tet2 protein abundance after TCR stimulation of CD4+ T cells as described in a, in presence of miR142-3p inhibitor, as revealed by flow cytometry, n = 6. e Normalized luciferase activity of HEK-293 cells cotransfected with miR142-3p mimic and wild-type TET2 3′UTR reporter construct, n = 4. f Levels of Tet2 mRNA in 3T3 fibroblasts transfected with miR142-3p mimic, as revealed by qPCR normalized to Histone mRNA, n = 6. g Levels of Tet2 mRNA after TCR stimulation of CD4+ T cells isolated from lymph nodes of miR142+/+ and miR142-/- mice, as revealed by qPCR normalized to Histone mRNA, n = 4. h Tet2 protein abundance after limited TCR stimulation of CD4+ T cells as described in g, as revealed by flow cytometry, n = 6. i In vitro Treg induction in presence of Tet2 siRNA, using naive CD4+ T cells isolated from lymph nodes of BALB/c mice, as revealed by flow cytometry, n = 6. j In vitro Treg induction in presence of Tet2 siRNA, using naive CD4+ T cells isolated from human peripheral blood, as revealed by flow cytometry, n = 4. One data point represents one subject. Experiments were performed in three technical replicates per subject. Data are presented as box-and-whisker plots with mean, 25% percentile, 75% percentile, minimum and maximum values or as means ± s.e.m. (a, c, e) Ordinary one-way ANOVA, Tukey’s multiple comparisons test. (b, d, f–j) Student’s t-test, *P < 0.05, **P < 0.01, and ***P < 0.001. The source data are provided as a Source Data file.

