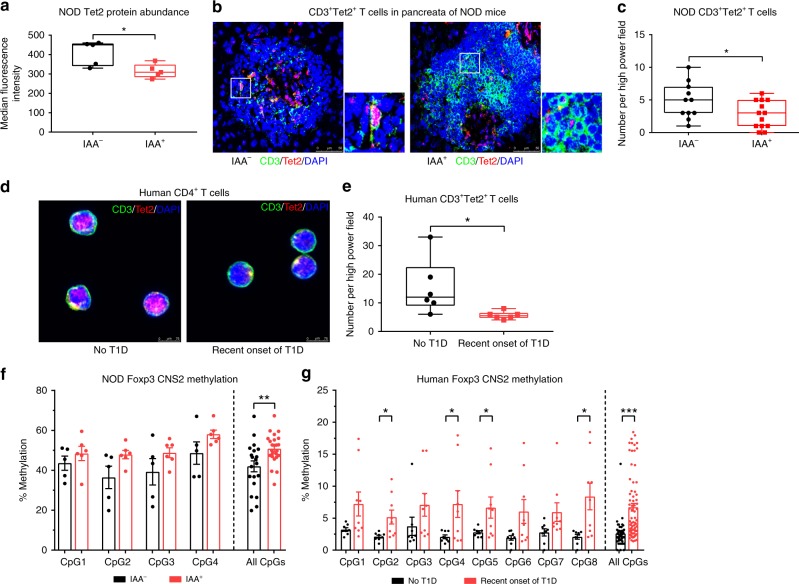
Fig. 6. Tet2 abundance and Foxp3 CNS2 methylation are changed in islet autoimmunity.
a Ex vivo Tet2 protein abundance (median fluorescence intensity) in CD4+ T cells isolated from pancreatic lymph nodes of NOD mice with and without islet autoantibodies, as revealed by flow cytometry, n = 5. b Immunofluorescence staining for CD3 (green), Tet2 (red), and DAPI (blue) in pancreas cryosections of NOD mice with and without islet autoimmunity. Scale bars: 50 µm. c Quantification of CD3+Tet2+ T cells per high-power field in samples from b, n = 12. d Immunofluorescence staining for CD3 (green), Tet2 (red), and DAPI (blue) in cytospins of human CD4+ T cells isolated from peripheral blood of individuals with and without recent onset of T1D. Scale bars: 75 µm. e Quantification of CD3+Tet2+ T cells per high-power field in samples from d, n = 6. f Methylation of the Foxp3 CNS2 (four CpG sites and combination of all sites) in Tregs isolated from pancreatic lymph nodes of female NOD mice with and without autoimmunity, as revealed by pyrosequencing, n = 6. g Methylation of the Foxp3 CNS2 (eight CpG sites and combination of all sites) in Tregs isolated from peripheral blood of male human subjects with recent onset of T1D and healthy controls, as revealed by pyrosequencing, n = 8. One data point represents one subject/one high-power field. Experiments were performed in two (f and g) or three (a) technical replicates per subject. Data are presented as box-and-whisker plots with mean, 25% percentile, 75% percentile, minimum and maximum values or as means ± s.e.m. (f, g) Ordinary one-way ANOVA, Tukey’s multiple comparisons test. (a, c, e) Student’s t-test, *P < 0.05, **P < 0.01, and ***P < 0.001. The source data are provided as a Source Data file.

