Fig. 2.
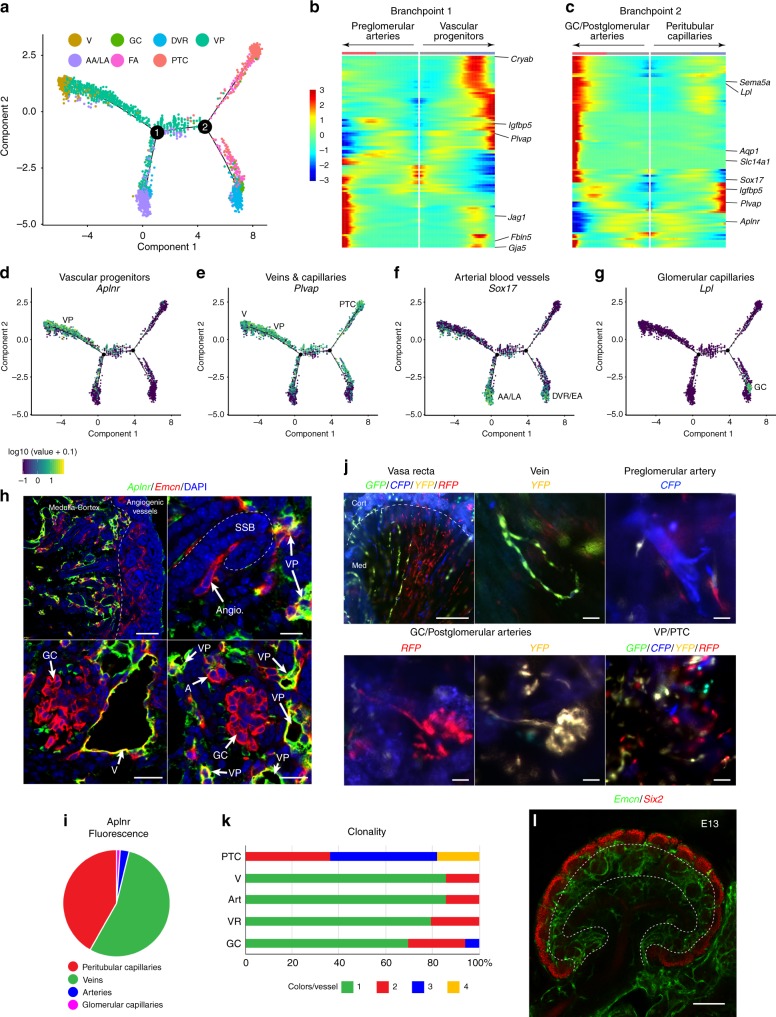
Analysis of vascular heterogeneity development. a Pseudotime trajectory of vascular differentiation in the kidney. VP, vascular progenitor; PTC, peritubular capillary; AA/LA, afferent arteriole/large arteries (pre-glomerular); AVR/V, ascending vasa recta/venous blood vessels; EA, efferent arteriole; GC, glomerular capillaries; DVR, descending vasa recta. b Heat maps denoting genes that become differentially expressed as pre-glomerular arteries branch from vascular progenitor cells. Notable genes of venous peritubular progenitor capillaries (Cryab, Igfbp5, Plvap) and arteries (Jag1, Fbln5, Gja5) are shown on the right. c Heat maps denoting genes that become differentially expressed as glomerular capillaries (GC) and postglomerular arteries branch from embryonic progenitor capillaries which mature into peritubular capillaries. Notable genes of glomerular capillaries (Sema5a, Lpl), postglomerular arteries (Aqp1, Slc14a1), and peritubular capillaries (Igfbp5, Plvap) are on the right. d–g Pseudo-time trajectory plots denoting the expression of genes enriched in particular vascular clusters. Plots include Aplnr in vascular progenitor cells (VP) (d), Plvap in veins (V), VPs, and peritubular capillaries (PTC)(e), Sox17 in afferent arterioles/large pre-glomerular arteries (AA/LA) and descending vasa recta/efferent arterioles (DVR/EA)(f), and Lpl in glomerular capillaries (GC)(g). h Immunofluorescent staining of the apelin receptor (Aplnr) in E17 kidney. Endothelial cells were stained with endomucin (Emcn). SSB, s-shaped body; VP, vascular progenitor; Angio., angiogenic vessel; GC, glomerular capillary; V, vein; A, arteriole. Scale bars: first panel 40 μm, second panel 5 μm, third and fourth panel 10 μm. i Pie chart denoting mean fluorescent intensity of Aplnr antibody staining in peritibular capillaries, veins, arteries, and glomerular capillaries. n = 3, average of 5 frames of view. j R26R-Confetti E18 mouse kidneys cut in half sagittally after tamoxifen induction at E11. GC, glomerular capillary; PTC, peritubular capillary. Scale bars: first panel 100 μm, second to sixth panel 5 μm. k Bar graph denoting the number of fluorescent reporters found in identified vascular structures. n > 10 for each structure. Art, Arteries; VR, Vasa Recta. l E13 mouse kidney showing the primary vascular plexus exists as generic capillaries (the vascular progenitor cells) before subvascular specification at E14-E15 stages. Dotted lines outline the cortex and medulla. Endothelial cells are stained with endomucin (Emcn) and the outer cortex of the kidney is denoted by Six2 staining of nephron progenitors. Scale bar 100 μm.

