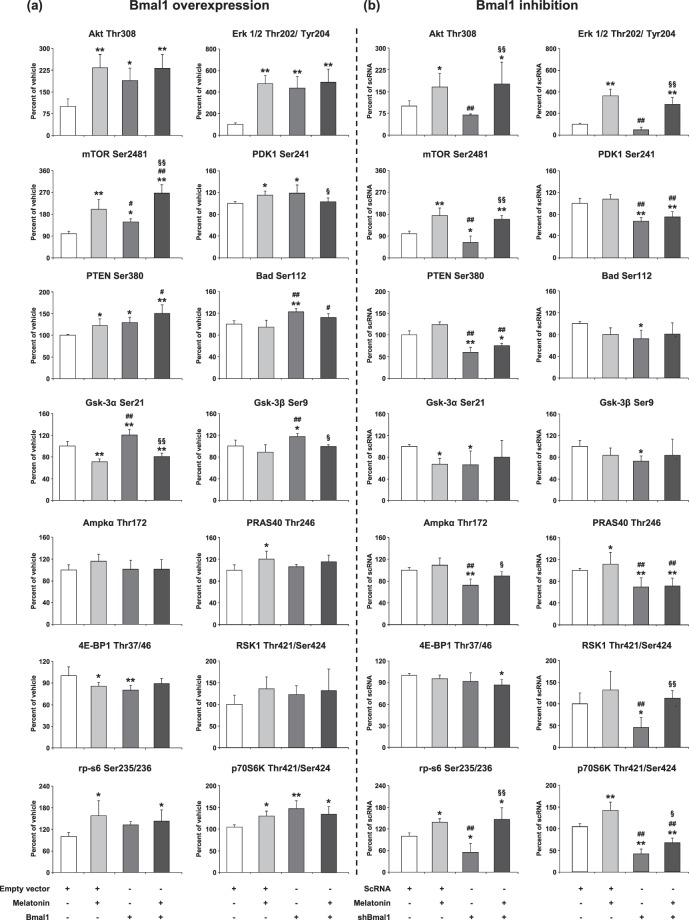
Figure 2.
The role of Bmal1 overexpression/inhibition and melatonin in the regulation of AKT pathway components after OGD. To analyze PI3K signaling pathway components, cell extracts were prepared and analyzed using PathScan® AKT Signaling Antibody Array Kit. p-AKT (Thr308), p-ERK-1/2 (Thr202/Tyr204), p-mTOR (Ser2481), p-Pdk1 (Ser241), p-PTEN (Ser380), p-Bad (Ser112), p-Gsk-3α (Ser21), p-Gsk-3β (Ser9), (i), Ampkα (Thr172), p-PRAS40 (Thr246), p-4E-BP1 (Thr37/46), p-RSK1 (Thr421/Ser424), p-rp-s6 (Ser235/236), p-p70S6K (Thr421/Ser424) were evaluated for Bmal1 overexpression (a) and Bmal1 inhibition (b). Representative images of planar surface immunoassay analysis were given in the Supplementary Fig. S6. Data are mean ± SD (n = 4/group). **p < 0.01/*p < 0.05 compared with vehicle (empty vector; pAcGFP1-N1 Vector), ##p < 0.01/#p < 0.05 compared with Melatonin, §§p < 0.01/§p < 0.05 compared with Bmal1 transfected group for (a) and **p < 0.01/*p < 0.05 compared scrambled RNA (scRNA), ##p < 0.01 compared with Melatonin, §§p < 0.01/§p < 0.05 compared with shBmal1 group for (b).

