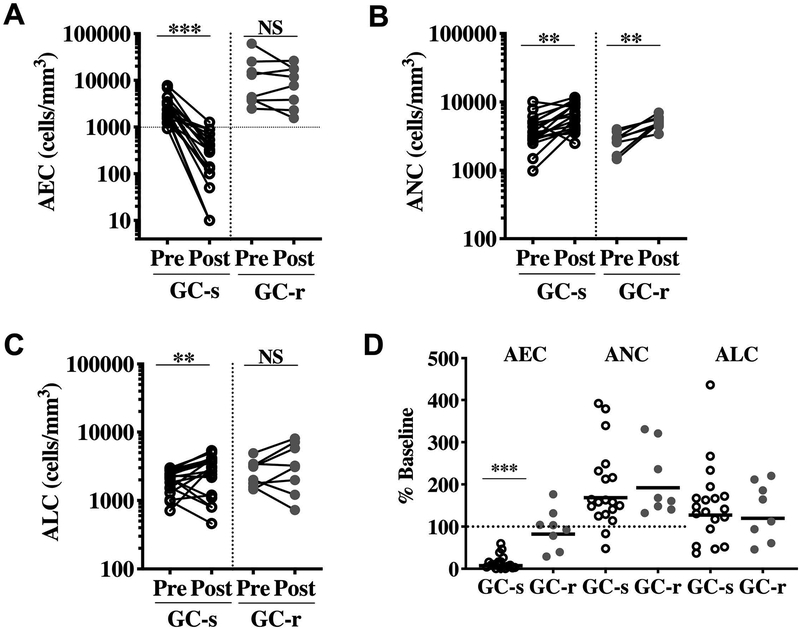
Figure 1. Cellular response to GC in HES.
Untreated subjects with HES were given a single dose of prednisone (1mg/kg) followed by prednisone (30 mg) daily for one week. (A-C) AEC, ANC, and ALC prior to and at 1 week following initiation of prednisone (D) Percent of baseline absolute cell counts at 1 week following initiation of prednisone. Symbols represent individual subject data (GC-sensitive (s; n=19; open black circles) and GC-resistant (r; n=8; closed gray circles). Solid horizontal lines indicate the GMs. The dotted horizontal line in panel D indicates 100% of baseline (no change). *p < 0.05, **p < 0.001, *** p < 0.0001

