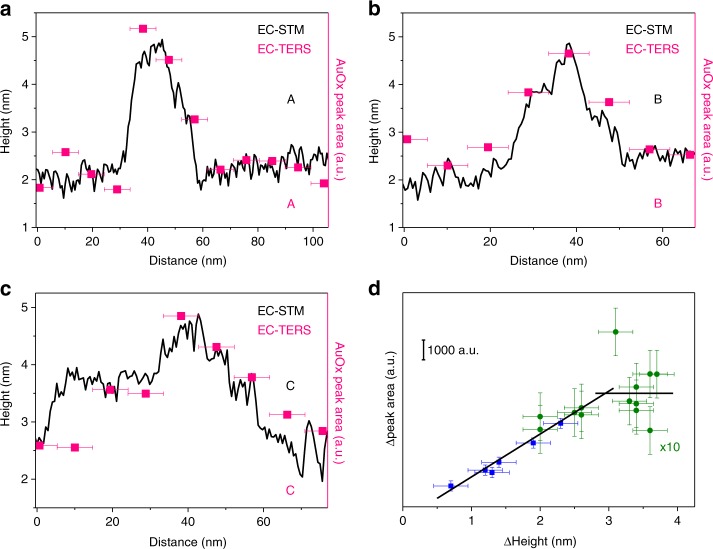
Fig. 3. Correlation between EC-STM height profiles and EC-TERS band intensities.
a–c EC-STM (black) and corresponding EC-TERS (pink) line profiles from regions marked with A, B, C in Fig. 2c–f. The distance error bars (x-error) are estimated to be of the pixel size, i.e. ± 4.7 nm. d Difference in gold oxide (AuOx) peak area vs. difference in defect structure height. Blue and green data sets were recorded with different tips on different days and samples. The Δheight error bars are estimated to be ± 0.25 nm. The Δpeak area error bars are determined from the standard deviation either at flat Au regions or in the OFF state. Solid lines are guides to the eye.

