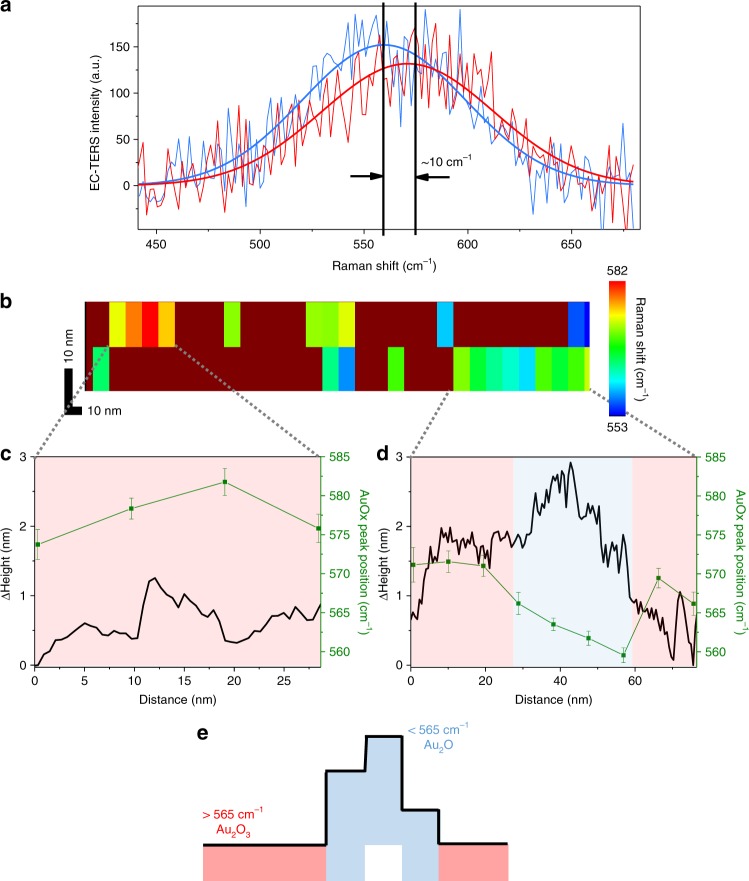
Fig. 4. Nm-resolved chemical nature of AuOx species.
a Two example EC-TER spectra (background subtracted) recorded at different AuOx defect locations and corresponding Gaussian peak fits, exhibiting a difference in peak position of ~ 10 cm−1. b EC-TERS map reconstructed from the AuOx peak position corresponding to the upper part of Fig. 2f. c, d Correlation between Δheight profiles and EC-TERS peak positions. The y-error bars represent the standard deviation of the bootstrapping fitting analysis (see Supplementary Note 6 for details). e Schematic illustrating the difference in AuOx peak position, i.e, in chemical nature, at different locations on the nanodefect.

