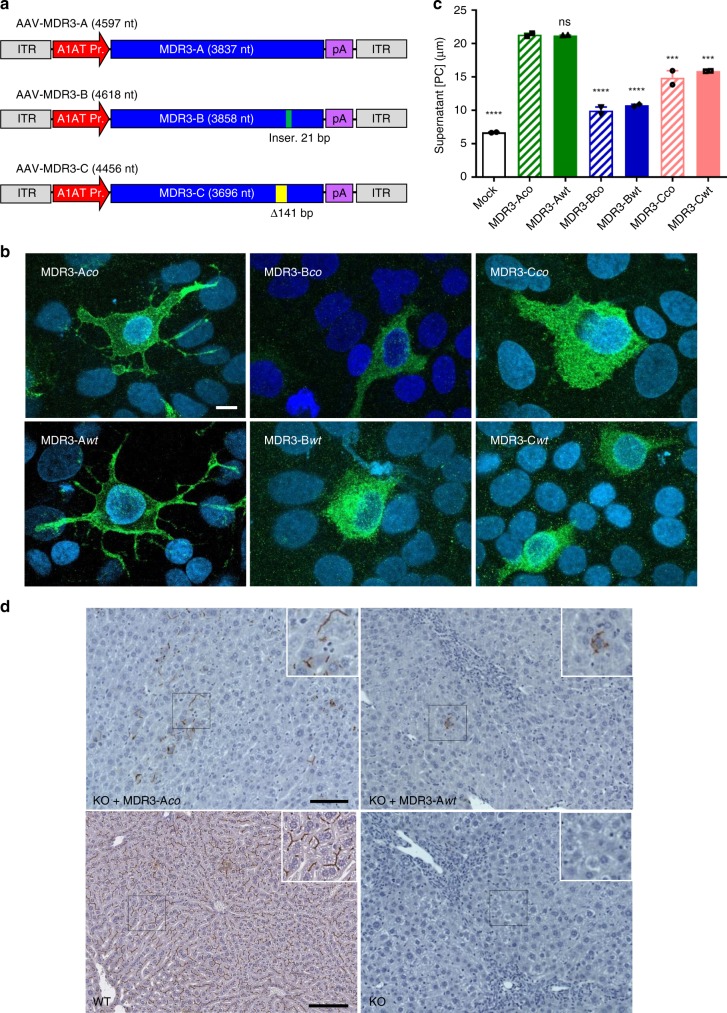
Fig. 1. AAV-MDR3 vectors and analysis of plasmid expression.
a Diagrams of AAV vectors expressing MDR3 isoforms A–C downstream of the alpha-1 anti-trypsin promoter (A1AT Pr.). Insertion (Inser.) and deletion (Δ) present in isoforms B and C, respectively, are indicated. ITR, AAV inverted terminal repeats; pA, synthetic polyadenylation signal. b MDR3 expression in vitro. HuH-7 cells were transfected with AAV plasmids containing the indicated MDR3 isoform and analysed at 48 h by confocal immunofluorescence with an antibody specific against MDR3. For MDR3-Aco and MDR3-Awt, images correspond to representative serial planes of MDR3-positive cells showing clear membrane-localized expression. For isoforms MDR3-B and C, images showed a combination of all planes since no membrane staining was observed in any plane. Nuclei were stained with DAPI. Scale bar = 10 μm. c MDR3 activity in vitro. PC concentration in the supernatant of cells transfected with AAV plasmids was quantified by fluorometric assay. Cells transfected with a GFP-expressing plasmid served as negative control (mock). Equivalent transfection efficiencies were verified via qPCR with primers specific for A1AT promoter. Labels above individual bars indicate significance relative to MDR3-Aco (one-way ANOVA/Tukey’s multiple comparisons test): ns, not significant, ***, p < 0.001; ****, p < 0.0001. Data are presented as mean ± standard deviation (SD). F values and degrees of freedom (numerator, denominator): F(6,7) = 151.1. Source data are provided as a Source Data file. d MDR3 expression in vivo. Abcb4−/− mice (KO) were HDI injected with AAV plasmids harbouring the indicated MDR3-A gene variant, and MDR3 expression was analysed by IHC with an anti-MDR3-specific antibody 24 h later. Abcb4+/+ (WT) and non-treated KO mice were used as positive and negative controls, respectively. Representative pictures from one mouse in each group are shown. Scale bar = 100 μm.

