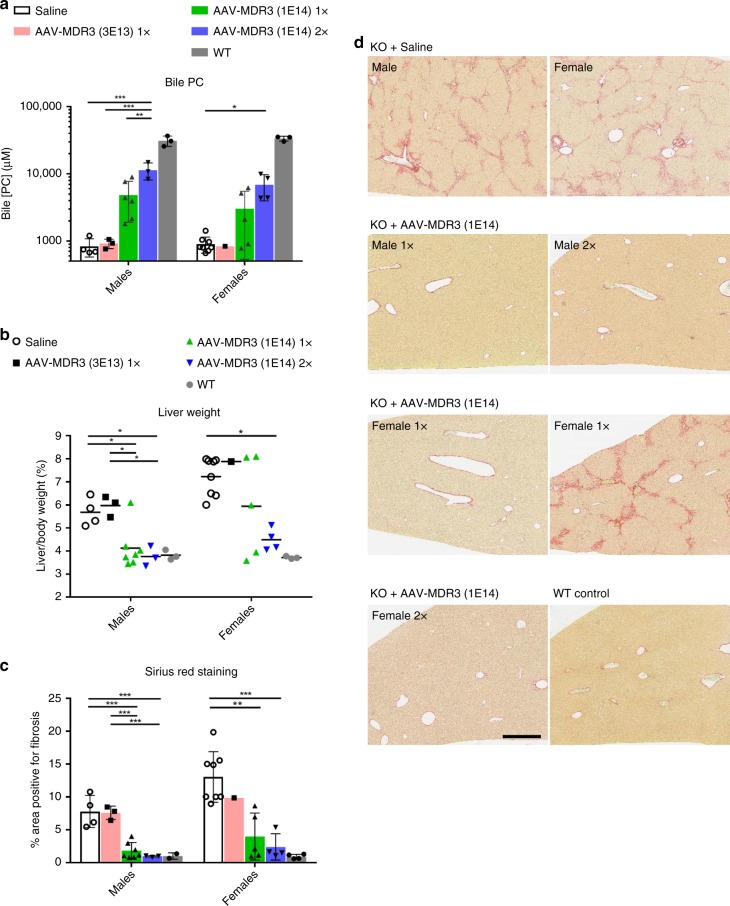
Fig. 4. Biliary PC and evidence of cholestasis for Abcb4−/− mice treated with AAV-MDR3-Aco.
At the time of sacrifice, PC concentration in bile (a) and liver weight as a percent of body weight (b) were measured for Abcb4−/− mice treated with AAV-MDR3-Aco at 3 × 10¹³ VG/kg 1× (pink bars or black squares; n = 3 M/1 F), at 1 × 10¹⁴ VG/kg 1× (green bars or green triangles; n = 7 M/5 F), or at 1 × 10¹⁴ VG/kg 2× (blue bars or blue inverted triangles; n = 3 M/4 F), as well as saline-treated controls (white bars or open circles; n = 4 M/8 F) and untreated WT mice (grey bars or grey circles; n = 3 M/3 F). Liver sections were stained with picrosirius red to indicate fibrosis (d) and the amount of tissue with red staining was quantified (c). Representative pictures from one mouse in each group are shown, except for females treated 1× at 1 × 10¹⁴ VG/kg, for which one animal each from both responder (left image) and non-responder (right image) groups is shown. Scale bar = 500 μm. Statistics (one-way ANOVA/Tukey’s multiple comparisons test): *, p < 0.05; **, p < 0.01; ***, p < 0.001; data are presented as mean ± SD; F values and degrees of freedom (numerator, denominator): a males: F(3,12) = 14.52, females: F(3,15) = 4.58; b males: F(3,13) = 8.548, females: F(3,14) = 4.501; c males: F(3,13) = 23.13, females: F(3,14) = 11.58. Source data are provided as a Source Data file.

