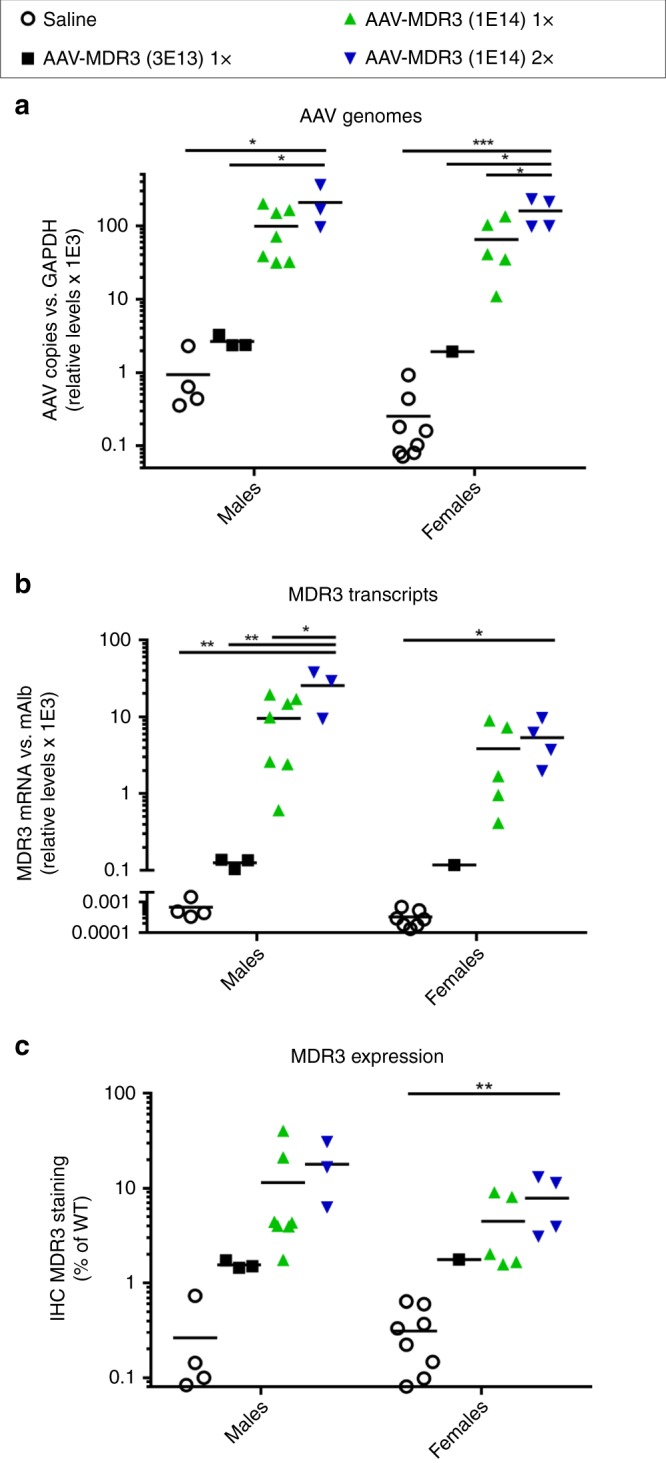
Fig. 5. AAV transduction and transgene expression for Abcb4−/− mice treated with AAV-MDR3-Aco.

The levels of AAV genomes (a), MDR3 mRNA transcripts (b), and MDR3 protein expression (c) were quantified from liver tissue harvested from Abcb4−/− mice treated with AAV-MDR3-Aco at 3 × 10¹³ VG/kg 1× (black squares), at 1 × 10¹⁴ VG/kg 1× (green triangles), or at 1 × 10¹⁴ VG/kg 2× (blue inverted triangles), as well as saline-treated controls (open circles). AAV genomes and MDR3 transcripts were quantified via qPCR and RT-qPCR, respectively, and protein expression was quantified as the percent area of tissue that stained positive for MDR3 expression and normalized to levels in WT mice. Animals were sacrificed between 12 and 16 weeks after treatment. Statistics (one-way ANOVA/Tukey’s multiple comparisons test): *, p < 0.05; **, p < 0.01; ***, p < 0.001; data are presented as mean ± SD; F values and degrees of freedom (numerator, denominator): a males: F(3,13) = 6.057, females: F(3,14) = 12.74; b males: F(3,13) = 7.59, females: F(3,13) = 4.135; c males: F(3,13) = 2.073, females: F(3,14) = 5.696. Source data are provided as a Source Data file.
