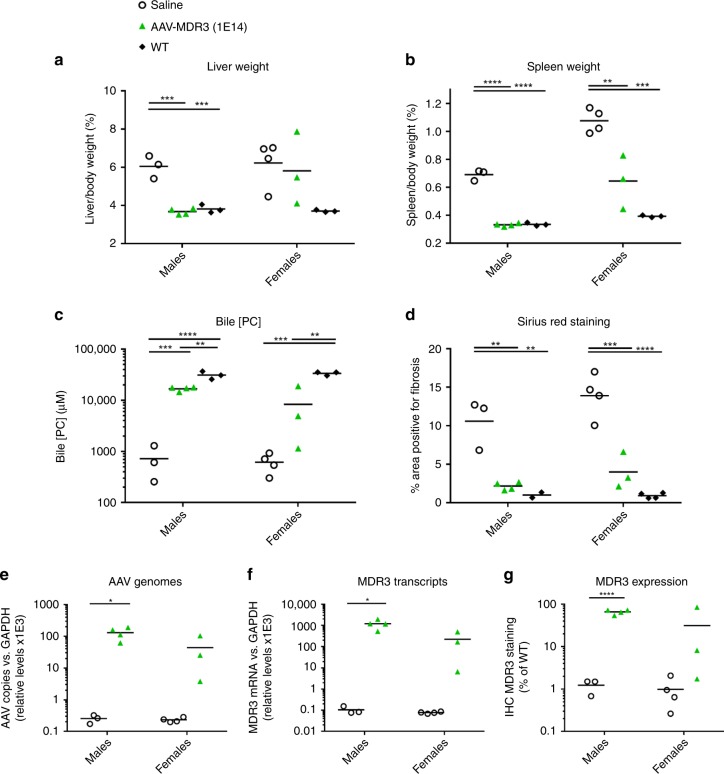
Fig. 7. PFIC3 disease parameters in Abcb4−/− mice treated at 5 weeks of age with AAV-MDR3-Aco.
At the time of sacrifice, liver (a) and spleen (b) weight as a percent of body weight, PC concentration in bile (c), liver fibrosis (d), AAV genomes (e), MDR3 transcripts (f), and MDR3 protein expression (g) were measured for Abcb4−/− mice treated with AAV-MDR3-Aco at 1 × 10¹⁴ VG/kg 1× (green triangles; n = 4 M/3 F), and saline-treated controls (open circles; n = 3 M/4 F) and untreated WT mice (black diamonds; n = 3 M/3 F). Animals were sacrificed 12 weeks after treatment. Statistics (one-way ANOVA/Tukey’s multiple comparisons test): *, p < 0.05; **, p < 0.01; ***, p < 0.001, ****, p < 0.0001. a–d F values and degrees of freedom (numerator, denominator): a males: F(2,7) = 44.52, females: F(2,7) = 3.558; b males: F(2,7) = 265.5, females: F(2,7) = 30.81; c males: F(2,7) = 69.93, females: F(2,7) = 35.8; d males: F(2,6) = 21.02, females: F(2,8) = 39.88. e–g Unpaired t test (t-value and degree of freedom): e males: (t = 3.938, df = 5), females: (t = 1.737 df = 5); f males: (t = 3.557, df = 5), females: (t = 1.836, df = 5); g males: (t = 12.61, df = 5), females: (t = 1.37, df = 5). Source data are provided as a Source Data file.

